Tableau Tea Break Round Up: #1 - August 2020
The 1st monthly roundup of all the best Tableau news, content, webinars, tips and inspiration from August 2020.

Welcome to the first issue of Tableau Tea Break’s Monthly Round Up! Read on to find all the greatest Tableau content from August, as well as what’s new, our favourite quick tips and upcoming Tableau activities, events & webinars.
Tableau News
Tableau Conference 2020

We kick off with big news, Tableau Conference 2020 will be completely free and open to anyone to attend! For obvious reasons it’ll be held virtually this year and there’s three sessions scheduled between 6th & 8th October 2020 for Europe, Americas & Asia Pacific time zones. It promises to be a big turn out so make sure to register or click the image above for more info.
2020 Tableau Ambassadors

Tableau just announced the 169 Tableau Ambassadors for 2020. 94 new ambassadors join 75 that continue from 2019 increasing by over 60% from last year. There’s also a brand new category of DataDev ambassadors and we’re looking forward to seeing what they bring.
Please join us in saying a bit congratulations to all those who were selected this year. You can read more about the Tableau Ambassador programme, and don’t forget to follow them on the twitter tableau ambassadors list.
Tableau 2020.3

Tableau 2020.3 was released in August bringing the ability to write to databases in Tableau Prep, automatically assign licenses on log in on Tableau Server and a lot of small improvements to current Tableau Desktop features.
We’re most excited about the improvements to relationships meaning you can join using calculations and inequalities which wasn’t possible before, the much needed ‘IN’ operator for calculations and some interesting looking options to utilise predictive analytics in tables calculations.
You can check out all the new features here or watch the short video here. Here’s the links to the release notes and downloads too:
You can also check out Tableau Tim’s What’s new in Tableau 2020.3 YouTube playlist or Interwork’s New Features Highlights for a run down of the new features.
Iron Viz 2020

Iron Viz season is in full swing and we’re seeing loads of great examples being shared on social media. The 10 finalists are due to be announced on Friday 4th September with the Iron Viz championship taking place in October.
You can find out all about Iron Viz and this year’s competition on the Iron Viz website. Andy Cotgreave is also running a number of webinars around Iron Viz that are worth checking out, find out more and register below:
A look back at Iron Viz 2019 (Thu, 17 Sept)
Meet the Iron Viz judges (Thu, 24 Sept)
Sneak peek at Iron Viz 2020 (Thu, 1 Oct)
Tableau Blog Posts Roundup
Here are our 20 favourite blog posts and articles from August (we’re a couple of days late finishing this so we’ve snuck a couple from September in too, shhh!)
03/09 - Biztory - intro into using the set actions filter dialog box.
03/09 - Sylvie Imbert The Information Lab - making dashboards more user friendly
02/09 - Mendelsohn Chan Interworks - social distancing floorplan for restaurants
01/09 - Matthew Whiteley Interworks - best new features for dashboarding in 2020.3
19/08 - Gregory Rimmer The Information Lab - dynamic org chart
14/08 - Jeffrey A. Shaffer Data + Science - removing Abcs from text tables
14/08 - dataviz.love - swap different views on a sheet with a single click
13/08 - Tesselation - how to use the new ‘IN’ function in Tableau 2020.3
10/08 - Andy Cotgreave - best of the Tableau Web Iron Viz edition
10/08 - Kevin Flerlage - awesome new features in Tableau 2020.3
08/08 - Sarahlovesdata - Iron Quest myths, mystery and magic
06/08 - Dataviz.love - showing variance between dates on a chart
05/08 - Danny Steinmez Interworks - navigating bias in data visualisation process
Videos & Webinars
In case you missed them here are five of our favourite videos, webinars or podcasts from August 2020:
1 hour Tableau dashboard challenge from Interworks (sign up needed)
What does it take to be a Tableau featured author - The Information Lab
Tableau 2020.3 relationships calculations - Lorna Brown from The Information Lab
Community building user group discussion - Podcast Your Data
Virtual Event Recap: The Good and Bad of Dashboard Templates
This Months Top 5 Tableau Tips
Tableau time saver - changing default aggregate for measures
Tableau Tea Break’s Quick Tip Of The Month: Right click (rather than left) when dragging an item into the view to bring up the context menu - go ahead try it out!
What else caught our eye this month
This New Viz: You Serious? from Kevin Flerlage, we love the visuals!

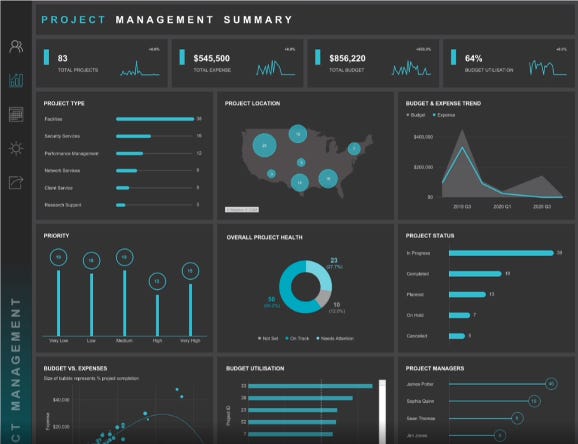
This business dashboard design from Pradeep Kumar G on LinkedIn:

Viz for Social Good posted an interesting new project - Bridges to Prosperity open until 30th September.
Vivek Kumar posted a list of 6 of the best tableau books to read to improve your data visualisations
These videos on the How to in Tableau in 5 minutes playlist on YouTube
Upcoming Free Training, Events & Webinars
24 Sep: Modern UX design in Tableau
We hope you enjoyed the first ever Tableau Tea Break Monthly Roundup! Issue 2 will be out at the start of October, in the meantime keep an eye out for new upcoming content from Tableau Tea Break each week.
As ever if you have any comments, feedback or suggestions for next month get in touch at @alan_murray84 or linkedin.com/in/alan-murray.


