Tableau Tea Break - Issue 2 - 1st November '20
Get the kettle on and enjoy the 2nd issue of our weekly Tableau newsletter updating you on everything happening in the Tableau universe and community this week.
Welcome to the second edition of our weekly Tableau newsletter. It’s that time of the week to grab a cup of tea and discover our recommended Tableau blog posts from the week plus our viz and tip of the week, the best Tableau YouTube video channels and everything Tableau that’s been going on this week. Enjoy the issue!
Top 5 Recommended Reads This Week
We take our weekly look at the Tableau universe and bring you our highlights and recommended blog posts from this week.
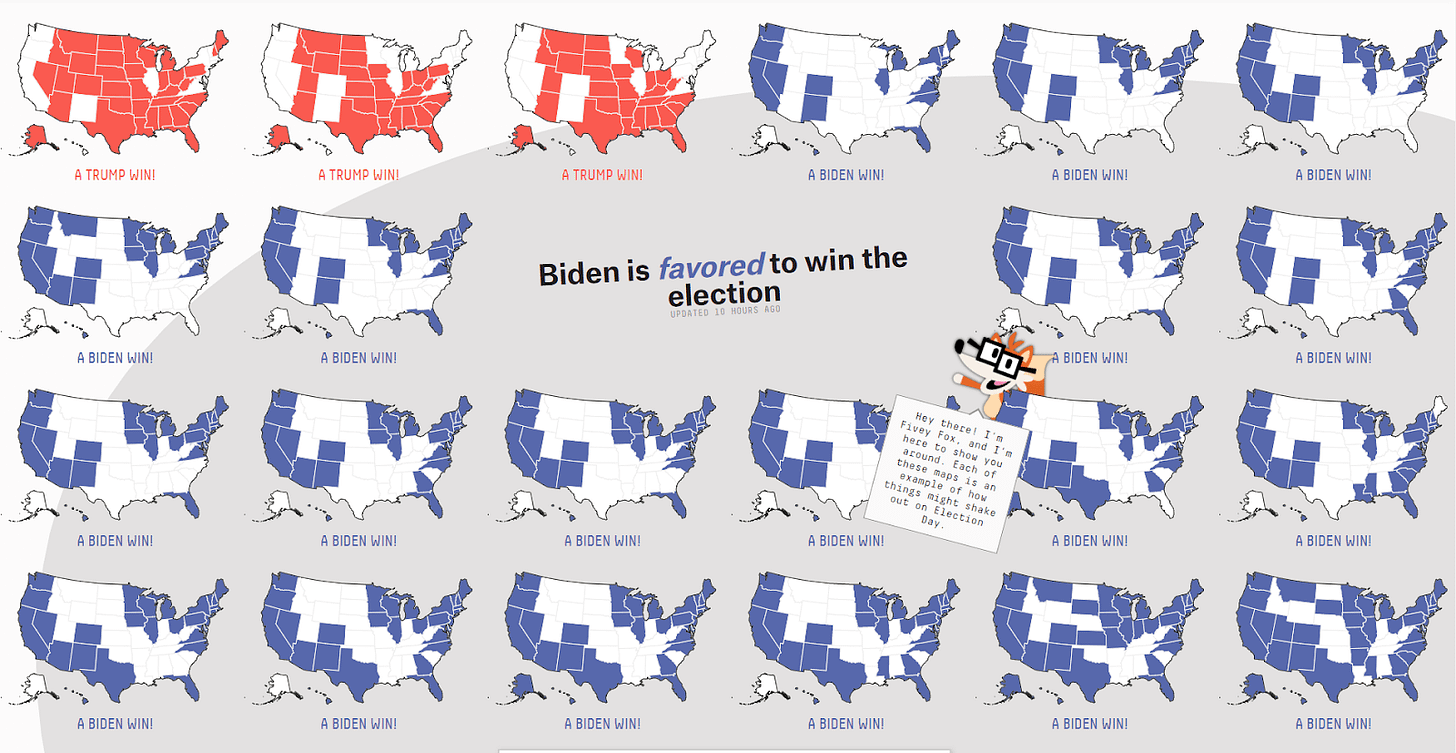
1. Five things data storytellers can learn from 2020 US election poll trackers
Andy Cotgreave gives us his 5 main takeaways from the lessons data storytellers can learn from 2020 US election poll trackers that we can apply to our own analyses:
For more insight on election 2020 also check out Tableau’s US Election 2020 Hub.
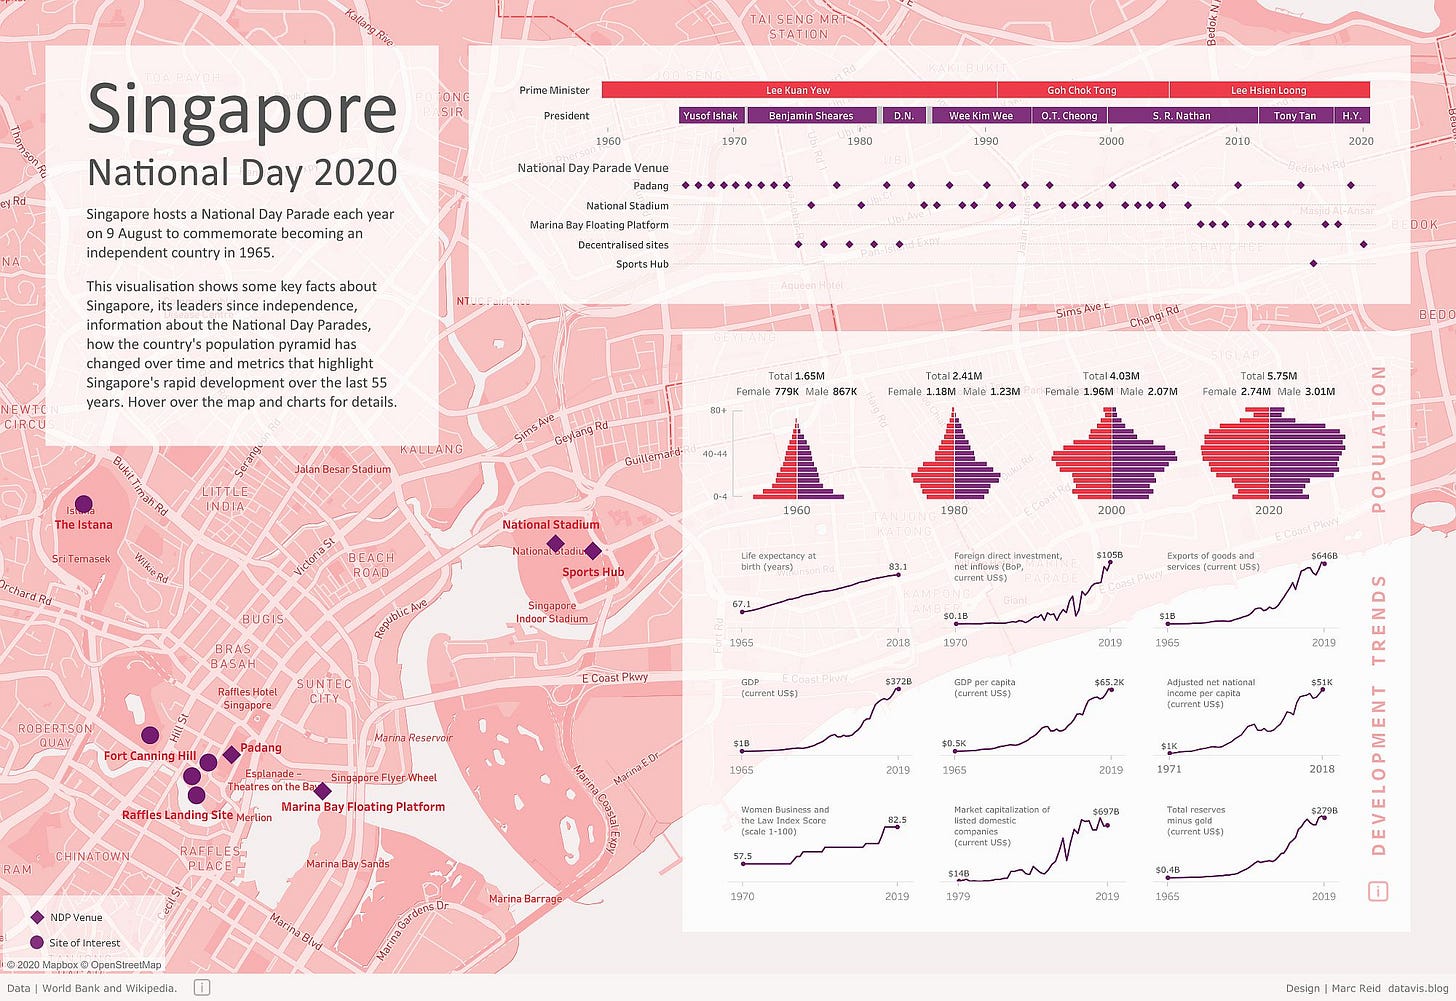
2. Using custom mapbox maps in Tableau
Find out how to create and utilise custom maps for Tableau by using mapbox with Marc Reid from Datavis:
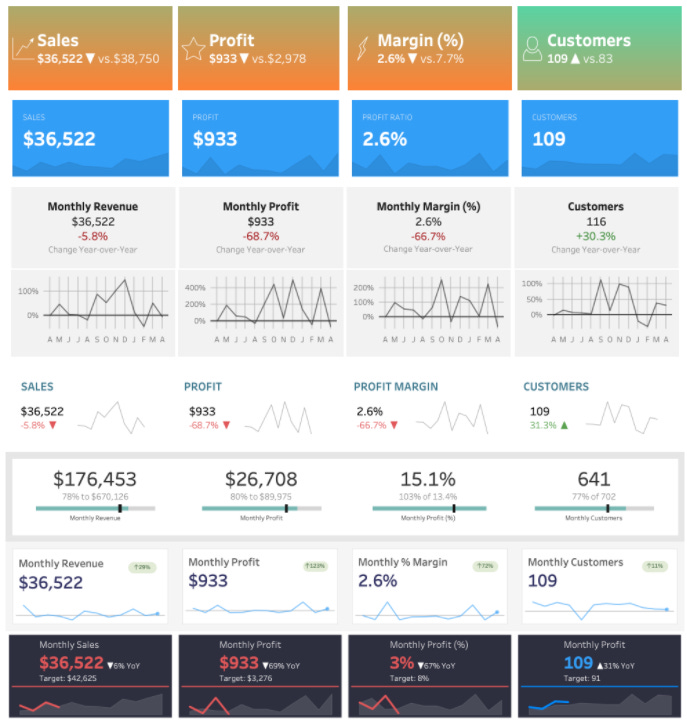
3. 15 design ideas for KPIs
Luke Stanke from Tesselation brings us 15 different ways to visualise KPIs:
4. How my COVID-19 dashboard evolved over the course of the pandemic
Florian Ramseger from Tableau uses his experience of building a covid-19 dashboard to reflect on the process for evolving and iterating a dashboard.
5. Calendar date picker in Tableau
Pallavi Naik gives us her take on creating a calendar date picker with parameter actions
Active blogs post - October update
We’ve just updated our ultimate list of active blogs for October, we’ll be updating this at the end of every month now. Here’s the update from October.
26 Blogs, YouTube Channels & Podcasts were still active in October
1 Podcast was newly active in October (Datum Podcast)
1 Blog active in September wasn’t active in October (Tableau Magic)
Viz of the week
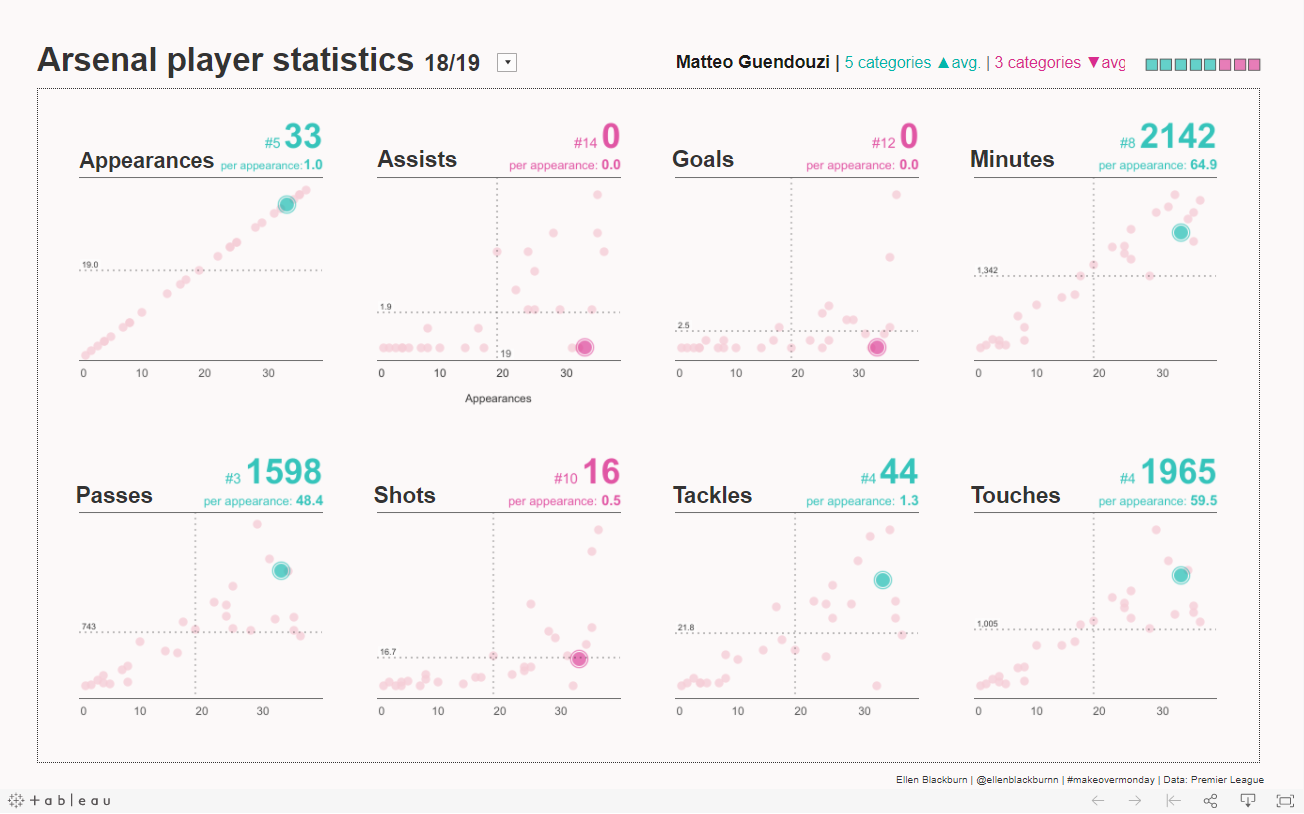
Each week we highlight a viz that caught our attention, this week we love this viz from Ellen Blackburn on the English football team (soccer, if you’re in the states) Arsenal (boo!). We really like how you can quickly see how each player stacks up against the rest of the team and what their relative strengths and weakness’ are:
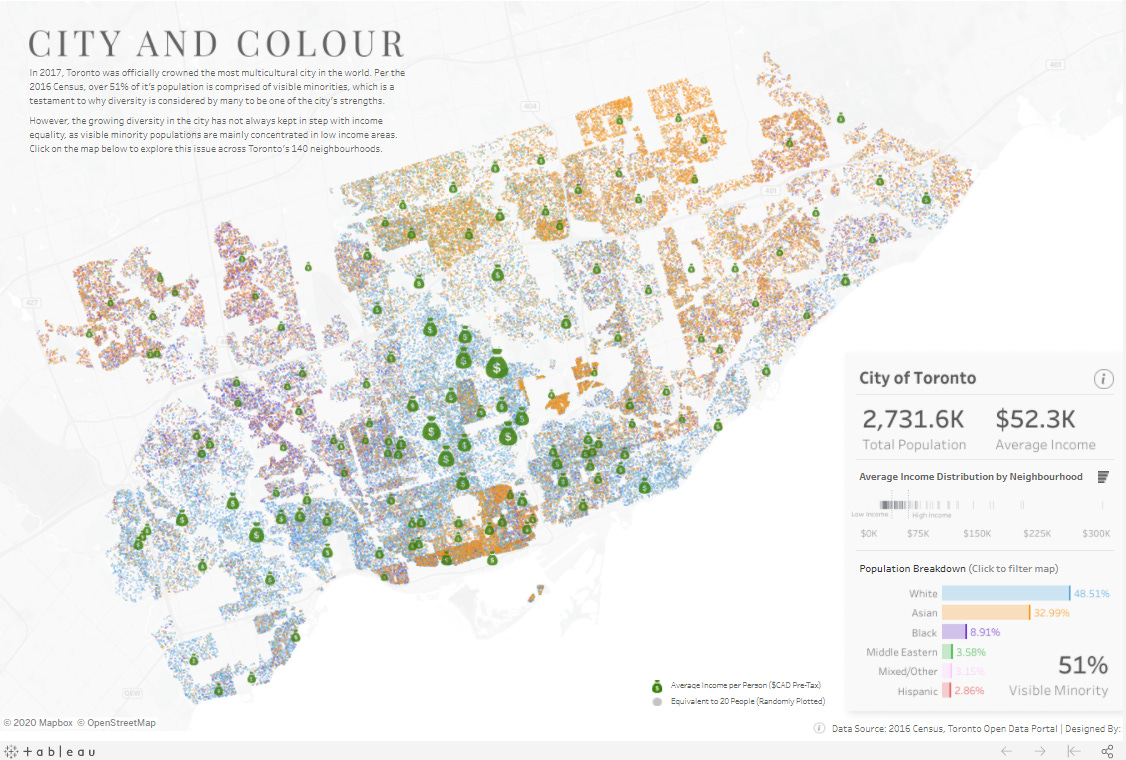
Special mention this week also goes to this viz from JR Copreros looking at income inequality in Toronto:
And Ken Flerlages 14 ways to visualise the US presidential election.
Tableau News
Iron Viz
This year’s Iron Viz competition reached it’s conclusion at TC with the winners of the global qualifiers battling it out for 20 minutes in front of the biggest audience to date.
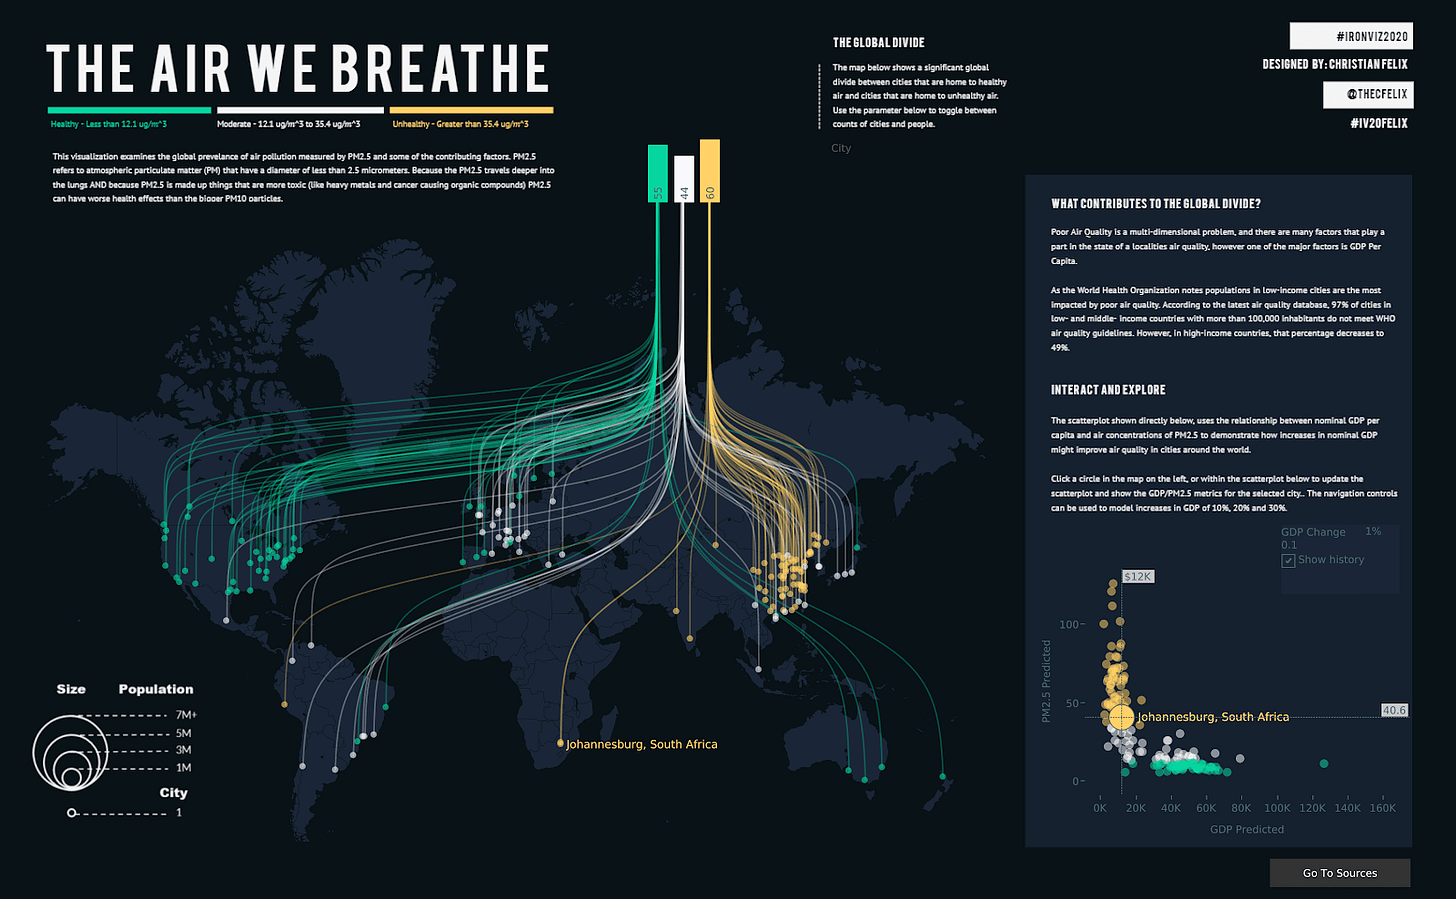
Congratulations to Christian Felix and a big shout out to the other finalists Alex Jones and Simon Beaumont.
Tableau Public Viz Gallery
With this year’s Tableau Conference going fully virtual one of the most popular features, the Tableau Public Viz Gallery had to be completely re-imagined. The team did a great job of coming up with a fully virtual gallery you could wander round and explore. It was due to stay open until 16th October but as we write this 2 weeks later it’s still open, check it out before it closes!
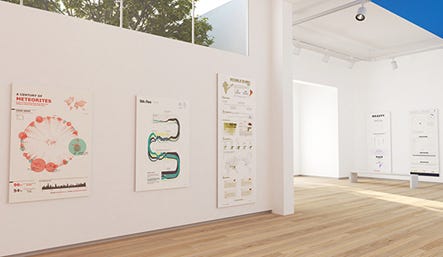
Ten most favourited public vizzes
It’s hard to believe Tableau Public is 10 years old this year, there have been an incredible 3 million vizzes published by over 1.5 million people in that time! To celebrate Tableau published a list of the ten most favourited vizzes from the last 10 years, be sure to check them out below and bookmark the excellent guides to using Tableau that are featured.
Tableau Style Guide
Candra McRae has put together this brilliant Tableau style guide, it’s a great resource for ideas and recommendations on everything from layouts to typography. It’s a great place to start if you need to create a Tableau style guide for your organisation (which every one should have!):
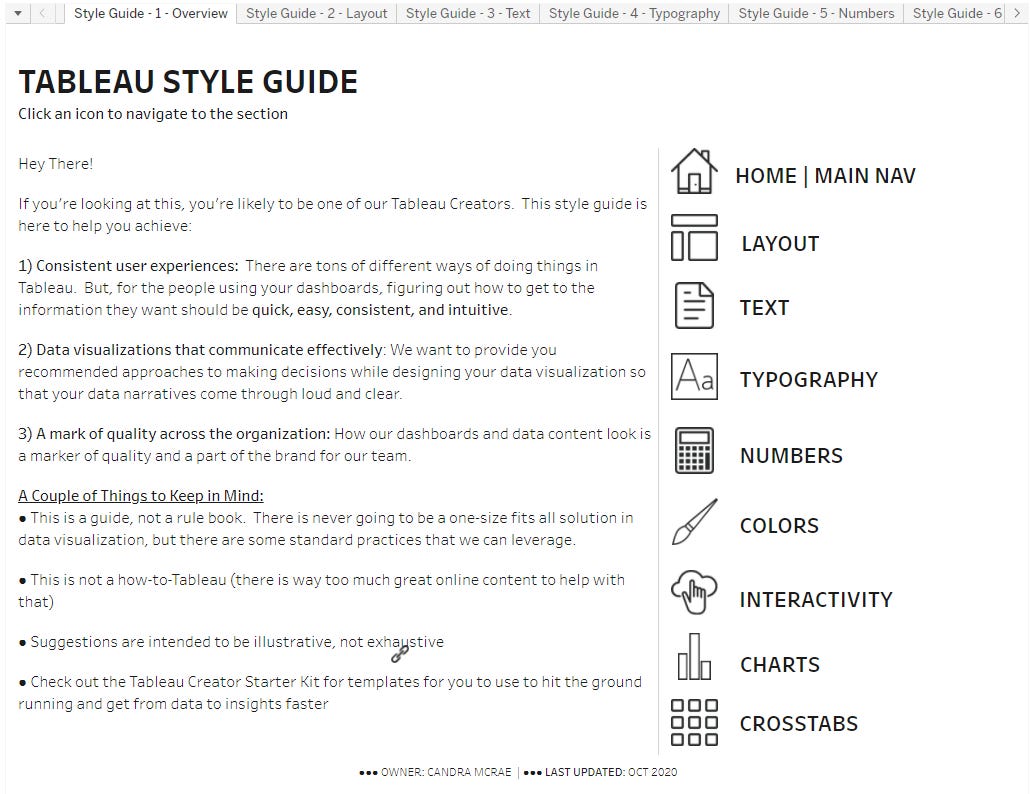
Tableau Public Featured Authors
Last Monday Tableau announced it’s latest 16 featured authors on Tableau Public. Sarah Bartlett shared their details on Twitter, be sure to follow them on Twitter and Tableau Public to check out their work:


Tip of the week
Our top tip this week is something we’ve been using a lot lately. Need to quickly mock some data up for Tableau or do you have some data in say Excel that you want to quickly get into Tableau? Simply copy and paste it in!
It’s that simple, highlight the data you want in Excel, right click and copy (or ctrl+c on windows), click into Tableau and ctrl+v (on windows) and the data will be pasted in and named as clipboardxxx in your data pane. When you save your file it will prompt you to save the data (or you can save it yourself whenever you want).
We cover this as well as our favourite top tips in our recent post.
Jeffrey A Shaffer recently put out a great post on his 10 Top Tableau Tips, it’s well worth a read!
Top Tableau YouTube Channels
This week we take a look at some of the best Tableau YouTube channels, these are a great way of picking up tips and tricks and learning about what’s new in Tableau.
Andy Kriebel
Andy is a prolific poster of videos with usually at least 1 new video a day. He regularly adds videos with quick ‘How to’ guides as well as the weekly Makeover Monday Reviews and his regular ‘WatchMeViz’ lets you watch his Makeover Monday attempts live,
Recommended Video: How to Unhide Row & Column Field Labels
Tableau Tim
Tim Ngwenga regularly posts ‘How to’ and explainer videos across a wide range of Tableau related topics. Recently there’s been some great videos explaining Tableau Prep and what it can do.
Recommended Video: What is Tableau Prep?
The Information Lab
The Information Lab post lots of insightful and short videos giving you quick tips and tricks. Their regular ‘How to Tableau’ series covers how to build different chart types and they often post about what’s happening in the Tableau community as well as new features.
Recommended Video: Get to know our Tableau Ambassadors
Official Tableau Channel
The official Tableau YouTube channel is packed with videos from across the Tableau community and universe. It’s also the place to catch all the recordings from Tableau User Groups and other events.
Recommended Video: Speed tipping favourites
We hope you enjoyed our 2nd issue of Tableau Tea Break. Look out for issue 3 next week and if you liked what you read share or subscribe below:
If you have suggestions or requests for future issues, feel free to get in touch @TableauTeaBreak or linkedin.com/in/alan-m-murray/
Thanks for reading,
Alan @ Tableau Tea Break.


