Tableau Tea Break #4 - 30th November 2020
This week we take a close look at some of our favourite Tableau Public viz inspirations, upcoming free learning events as well as our usual look at our top recommended Tableau reads.
Welcome to the fourth edition of our weekly Tableau newsletter. It’s that time of the week to grab a cup of tea and discover our recommended Tableau reads from the week, plus check out some of our favourite Tableau Public viz inspirations and don’t miss the free training events featured at the end. Enjoy the issue!
Top 5 Recommended Reads This Week
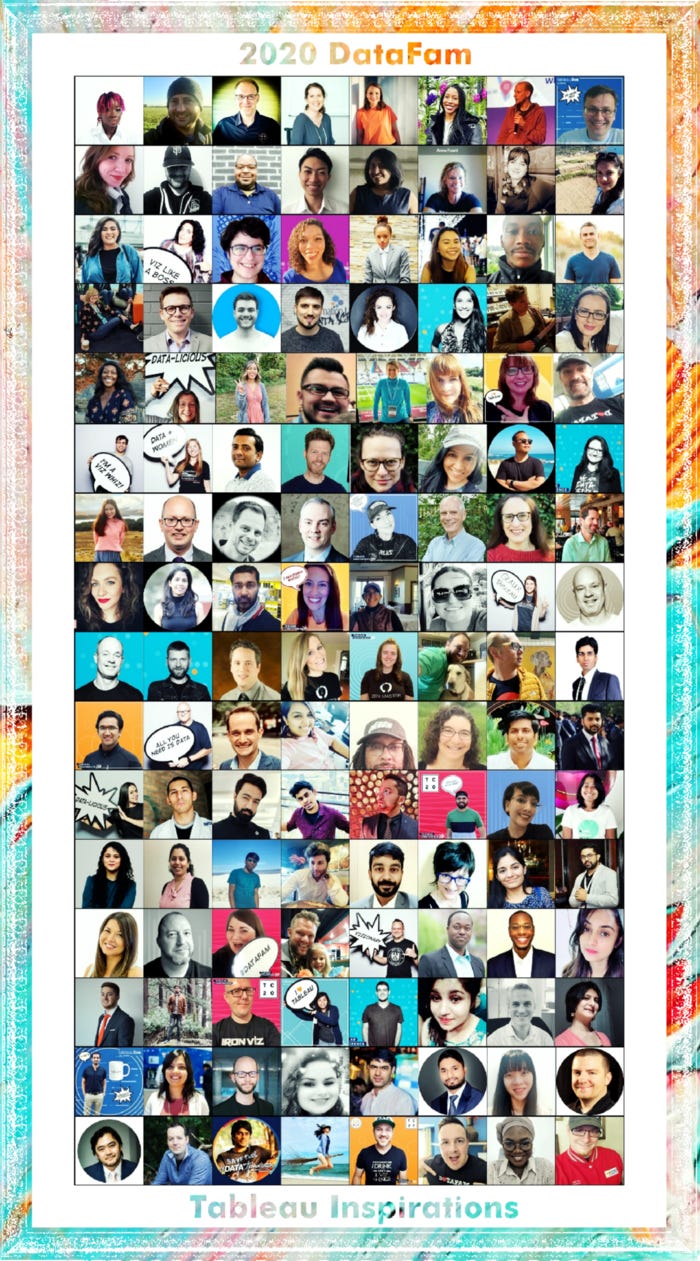
1. The #DataFam: 129 Authors From 21 Countries Spanning Six Continents Share Their 2020 Tableau Inspirations
This epic post compiled by Adam Mico gives a fascinating insight into what’s inspired and driven people from across the Tableau community this year. We highly recommend making time to read through this and hope it will inspire you too!
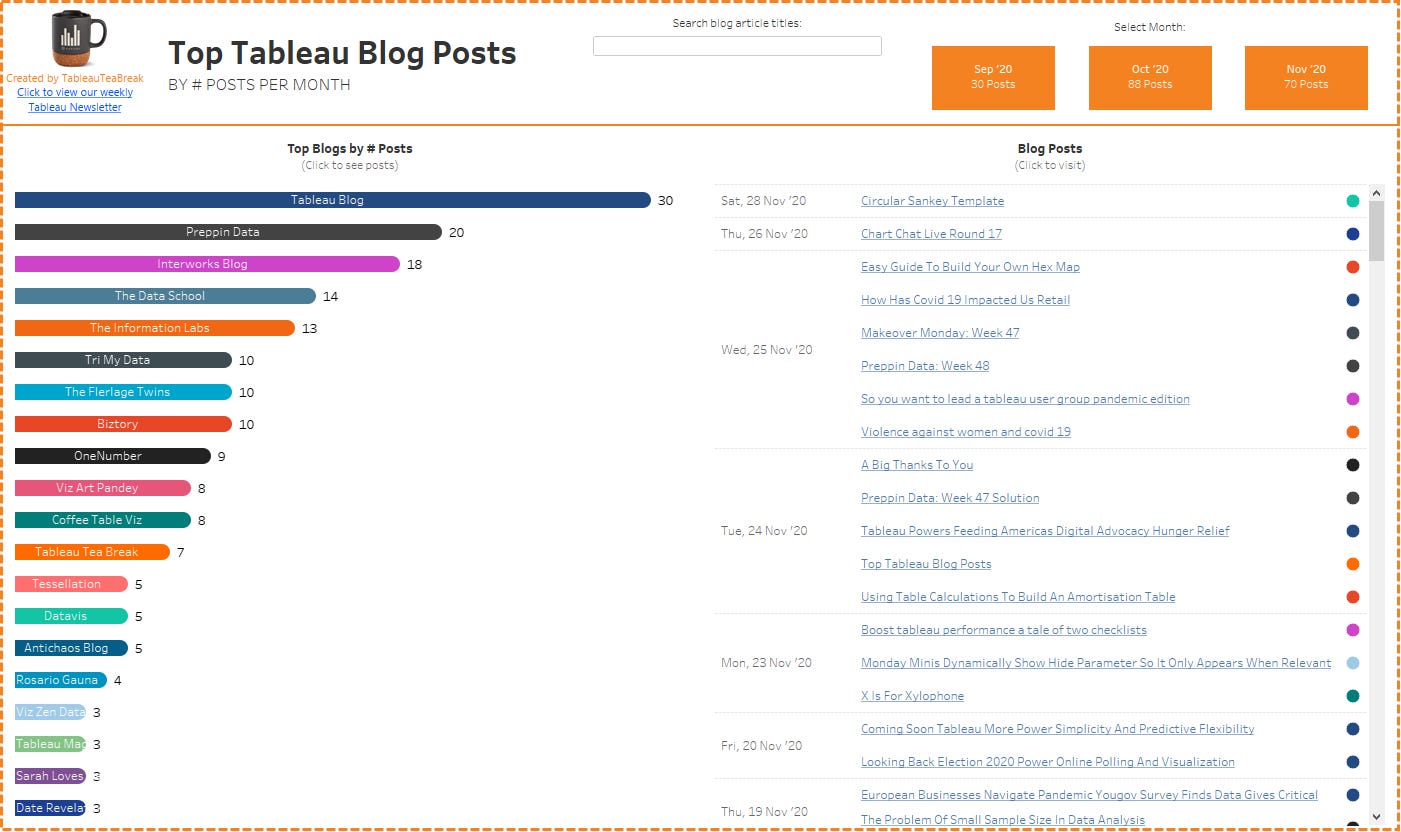
2. Top Tableau Blog Posts Viz
Last week we launched our Top Tableau Blog Posts viz on Tableau Public. We’re updating this at least weekly to help you find the best Tableau content. You can read more about it on our blog post or click the link below to view the viz:
3. So You Want To Lead A Tableau User Group - Pandemic Edition
Interworks bring us some great advice from current tableau user group leaders on what they consider essential for launching and running a TUG, both pre and post covid:
4. Monday minis - Dynamically show and hide parameters when relevant
Lindsay Betzendahl carries on her Monday minis series this week with a really useful guide on how to hide drop down menus when they’re not relevant depending on the options a user selects:
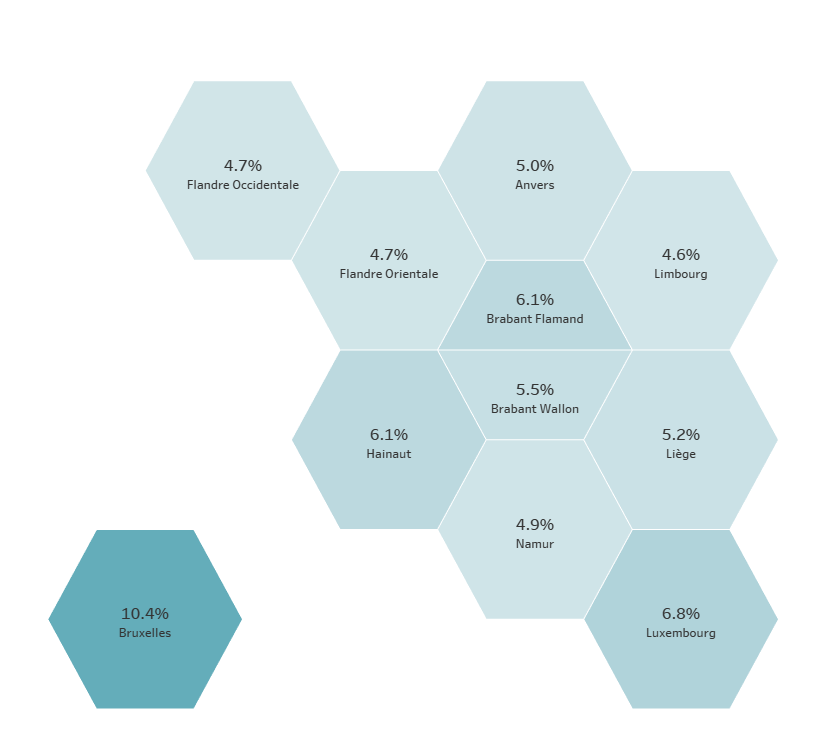
5. Easy guide to building your own hex map
You’ll have probably seen lots of hex maps in Tableau vizzes showing the US states, here Jérémy Calloud from Biztory shows us how to easily create your own hex map for other scenarios. In this case the hex map is depicting regions around Belgium:
Viz of The Week
Instead of our usual Viz of The Week we decided to take a look at a number of our favourite Tableau Public vizzes, check out the 7 we picked below.
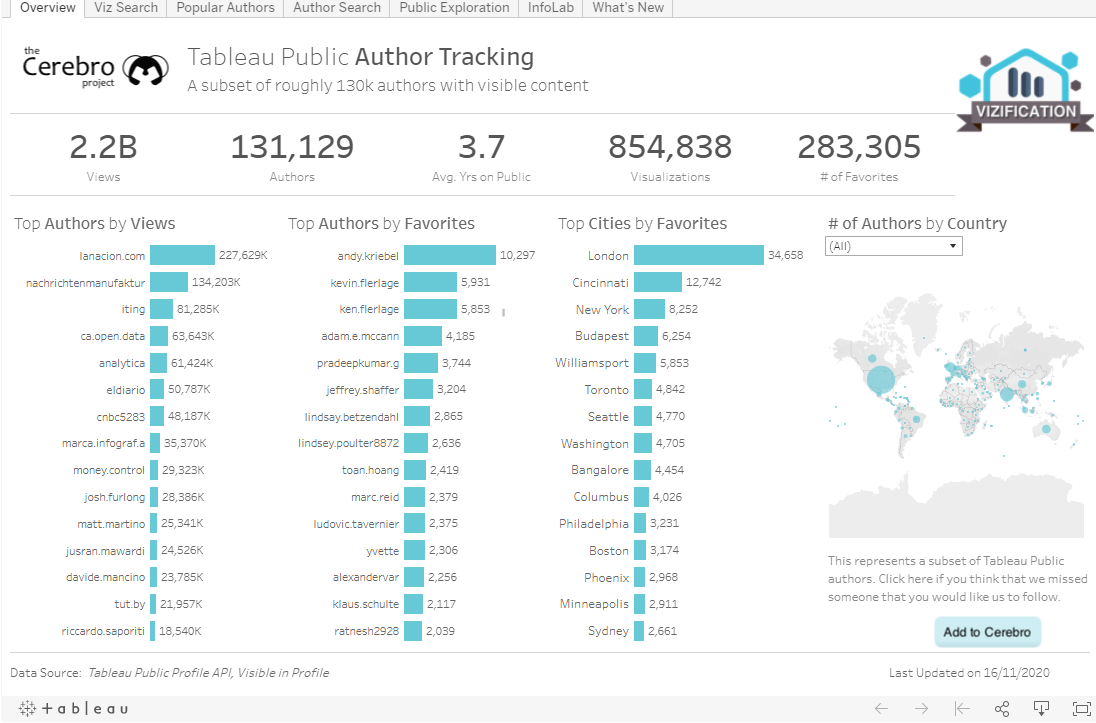
The Cerebro Project by Josh Tapley
This uses the Tableau Public API and is fantastic for finding who and what is hot on Tableau Public, we were pleasantly surprised to see our name appear in the Popular Authors tab this week!
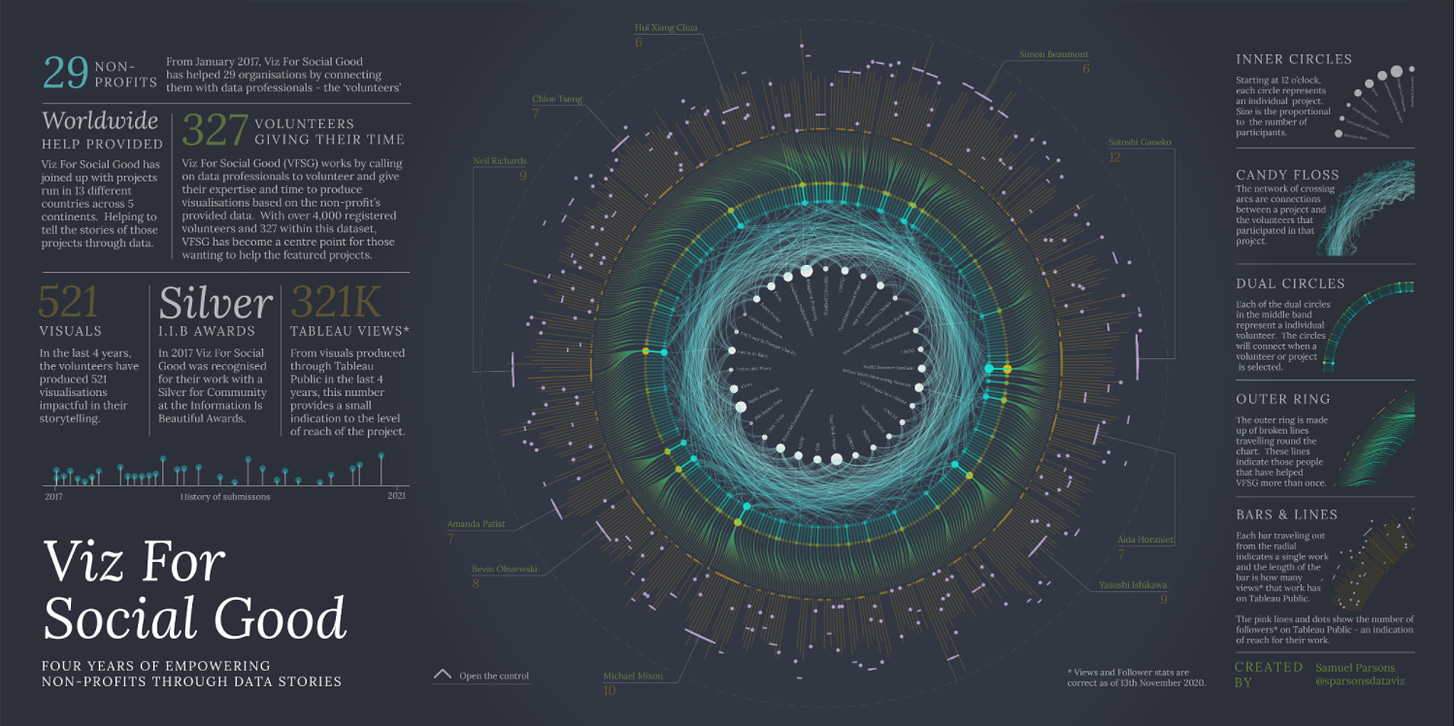
Viz For Social Good by Samuel Parsons
If you’re not familiar with Viz for Social Good this post from Dilyana Bossenz gives a good intro. The viz below gives a great reflection on 4 years of this initiative:
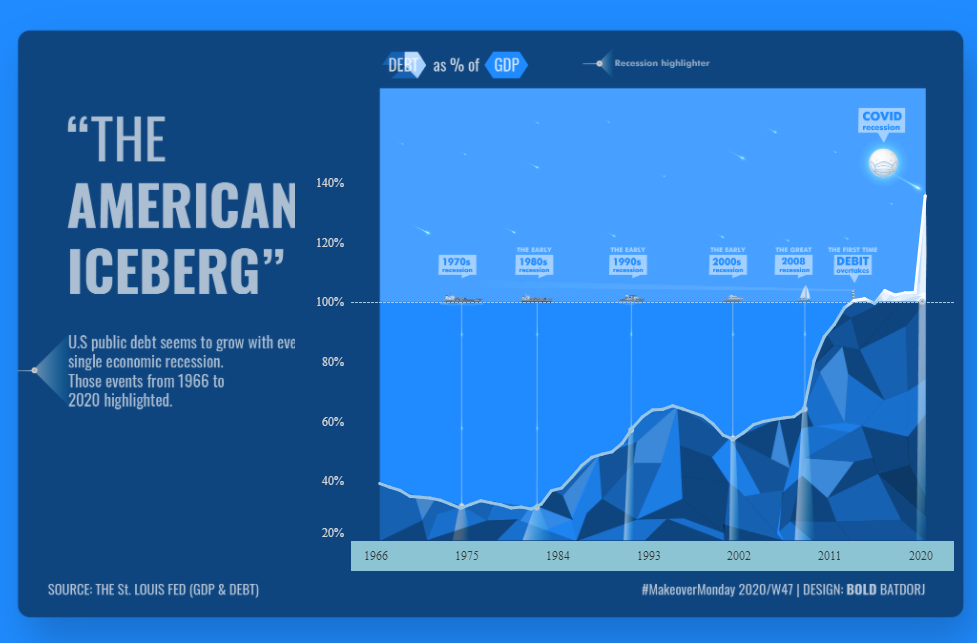
The American Iceberg by Bold Batdorj
We love the visuals on this take on US public debt for Makeover Monday:
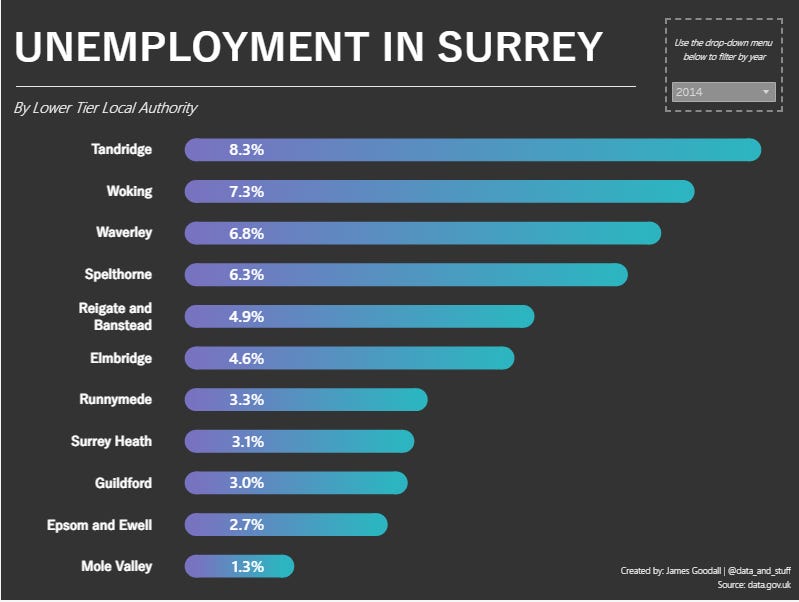
Rounded Bar Charts With Gradient Fill by James Goodall
Download the workbook to look at how this was done, the gradient bars are very cool! (Hint: use a line chart and path to achieve this effect):
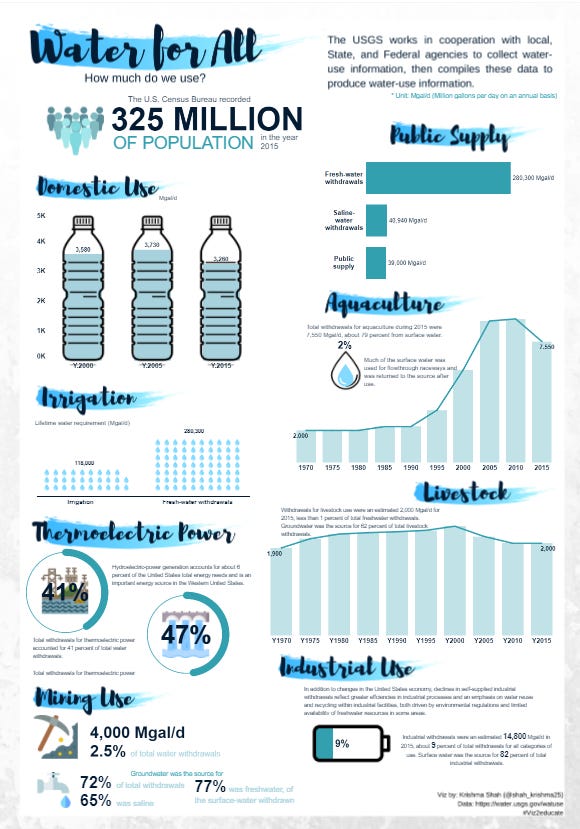
Water For All by Krishma Shah
This is a really clean and crisp infographic, the use of imagery and pictures in the charts and overall design is really impressive:
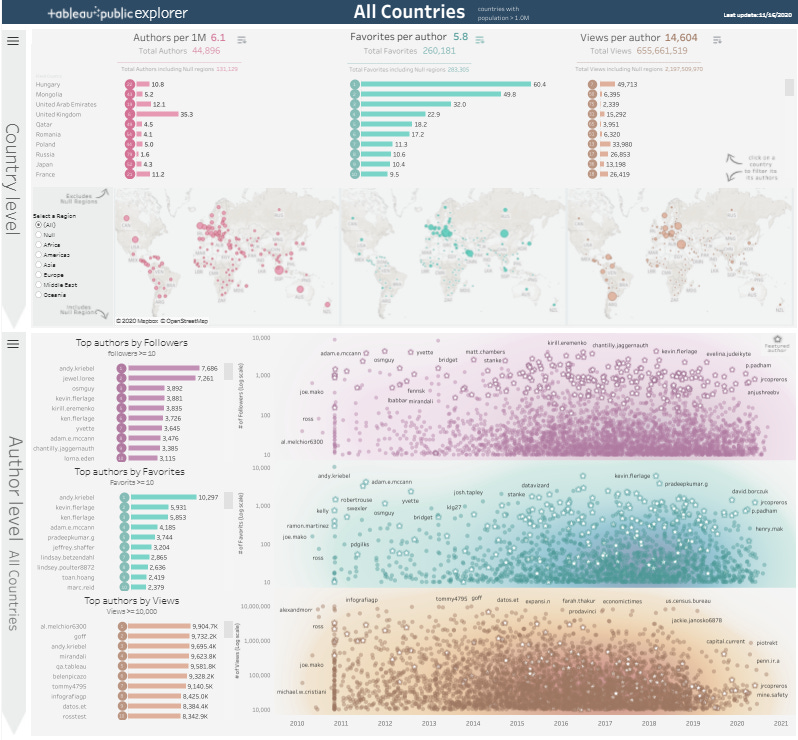
Tableau Public Explorer by Nir Smilga
Another great way to explore Tableau Public, the colours and layouts of this are really nice:
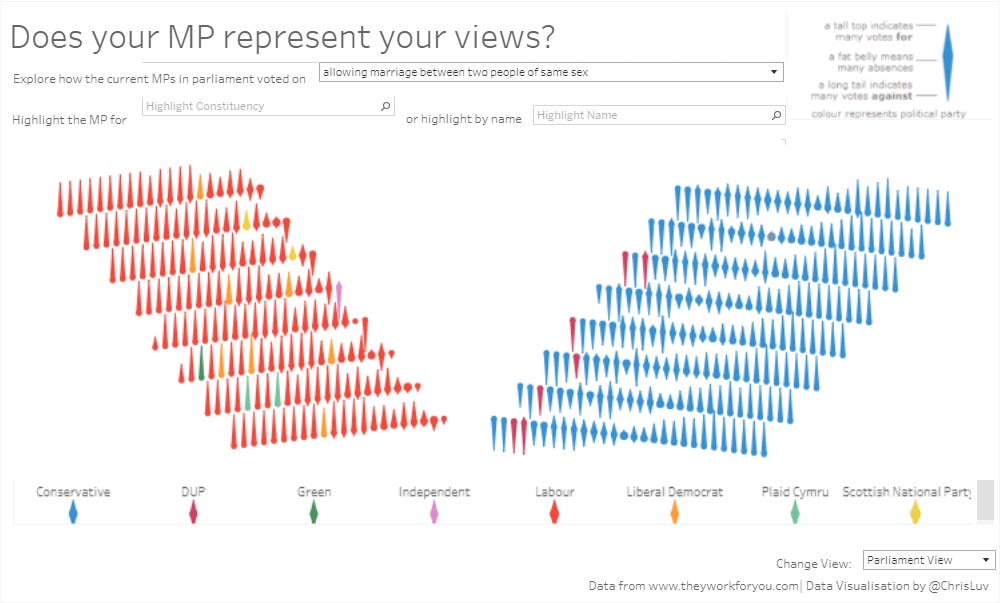
UK MP Votes by Chris Love
We really like how this is built to represent the UK houses of parliament, if you’re not from the UK or familiar with it have a look for some photos and you’ll see what we mean!
Free Webinars & Training
Don’t miss these free Tableau webinars and trainings coming up in the next couple of weeks:
Learn What The Data School Learns - Tue Dec 1st, 9:00am GMT
Building data sources you can trust - Tue Dec 1st, 12:30pm GMT
Lunch and learn: 3 Dashboards to Maximize Christmas Sales Revenue - Tue Dec 1st, 12:00pm SGT
Tableau Prep Virtual Test Drive - Tue Dec 1st, 10:30am AEDT
Thursday Trainings at Three - Thu Dec 3rd, 3:00pm GMT
Inspiring change with data visualization - Tue Dec 8th, 10:00am SGT
Beyond the Basics with Tableau Prep - Wed, Dec 9th, 11:00am AEDT
Introduction to Visual Analytics with Tableau - Thu, Dec 10th, 11:00am SGT
We hope you enjoyed this issue, we’d love to hear what you’d like to be featured in future issues, if you’ve got ideas or suggestions feel free to get in touch @TableauTeaBreak or linkedin.com/in/alan-m-murray/ and it would be great if you could spread the word by sharing this too!
Thanks,
Alan @ Tableau Tea Break.


