TTB #7: Custom date pickers, iron viz students edition, organise your workspace, job opportunities and more!
This week I show you how to create a simple custom date picker and give you tips on de-cluttering your Tableau workspace! We also have our first Tableau career path story as well as 30 Tableau job ops
Welcome to this weeks Tableau Tea Break! This week I’m excited to bring you the first of our Tableau career path insights (If you’d like to get involved you can share your story here) and I’ve also added even more Tableau job opportunities as well as my top tips, recommended reads and the 2nd in my How To Tableau…. series.
You’ve only got a couple of days left to tell us what you’d like to see in your Tableau Tea Break don’t miss your chance to shape the future of Tableau Tea Break, the survey will close at midnight on 31st January.
Enjoy the issue!
How To Tableau… #2: Simple Custom Date Picker
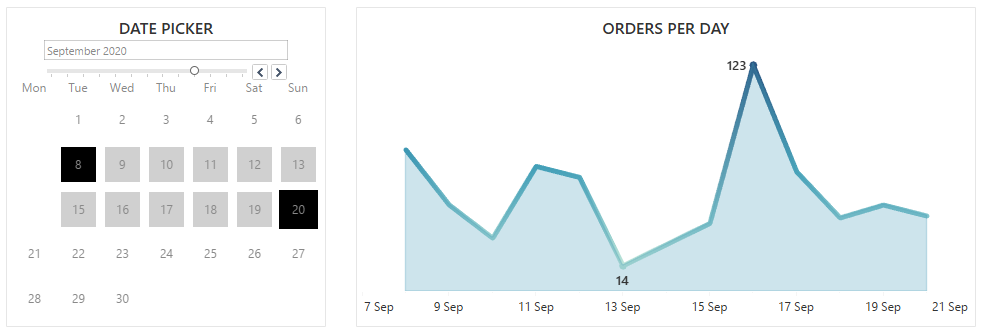
For this weeks How To Tableau… I show you how to create a simple custom date picker like this:
These are great for giving your users a nice and easy way to select dates and date ranges in just a couple of clicks.
I’ve put together full step by step details here: https://tableau.substack.com/p/how-to-tableau-simple-custom-date but here’s a quick summary of how to do this:
1. Create a sheet with a calendar view to act as your date picker
Grab a data source with some date based date in, then all we’re going to do is drag the date (Order Date in our example) as the WEEKDAY onto columns, then the WEEK onto rows and finally DAY onto the text and this will give you a very basic calendar view as above.
2. Create calculated fields to hold your dates
The next step is to create a parameter and 3 calculated fields as follows:
Dates String: Parameter that updates when a user clicks a date.
Starting Date: To hold the first date a user selects.
Ending Date: To hold the second data a user selects.
Date Updated: This will hold our starting date and ending date separated by a unique character. This will be used to input a date string to a parameter which can then be split to get our start and ending date.
To see how to do this, including the formulas to use in each field please see the more detailed post on creating a simple custom date picker.
3. Create a dashboard action to update the date parameter when a date is clicked
This part is really simple, all we’re going to do is set up a dashboard action that fires when a user clicks one of the days in our calendar view.
This will update our parameter using the formulas we set up in step 2 which will then populate our calculated fields to give us a selected start and end date:
4. Apply the filter to some real data
We can now use the same technique to apply the filter to some actual data and charts.
All we have to do is create another calculated field which check if each date is within the selected date range. If it is it returns TRUE otherwise it returns FALSE and we simply filter out all the FALSE records.
5. Make it look good!
We’ve now got a functional custom date picker but we want it to look a bit better! Apply some formatting and set up some highlights on the selected date range and add in a way to scroll between months and we have something that looks a lot better (detailed steps are here: creating a simple custom date picker)
And there you go, a simple custom date picker! Give it a go and let us know what you think or how you’ve expanded on this idea with additional functionality.
My Tableau Top Tips
Create more room in your viz
If you need a bit more room on your screen, here are a few quick tips to optimise your Tableau panes!
First, did you know you can hide the Data/Analytics pane? Just click those tiny two arrows and zoom it’s gone! To get it back look at the little tab that’s appeared in your status window, just click those arrows to restore it.
This is great for when your formatting a sheet and don’t need the data pane:
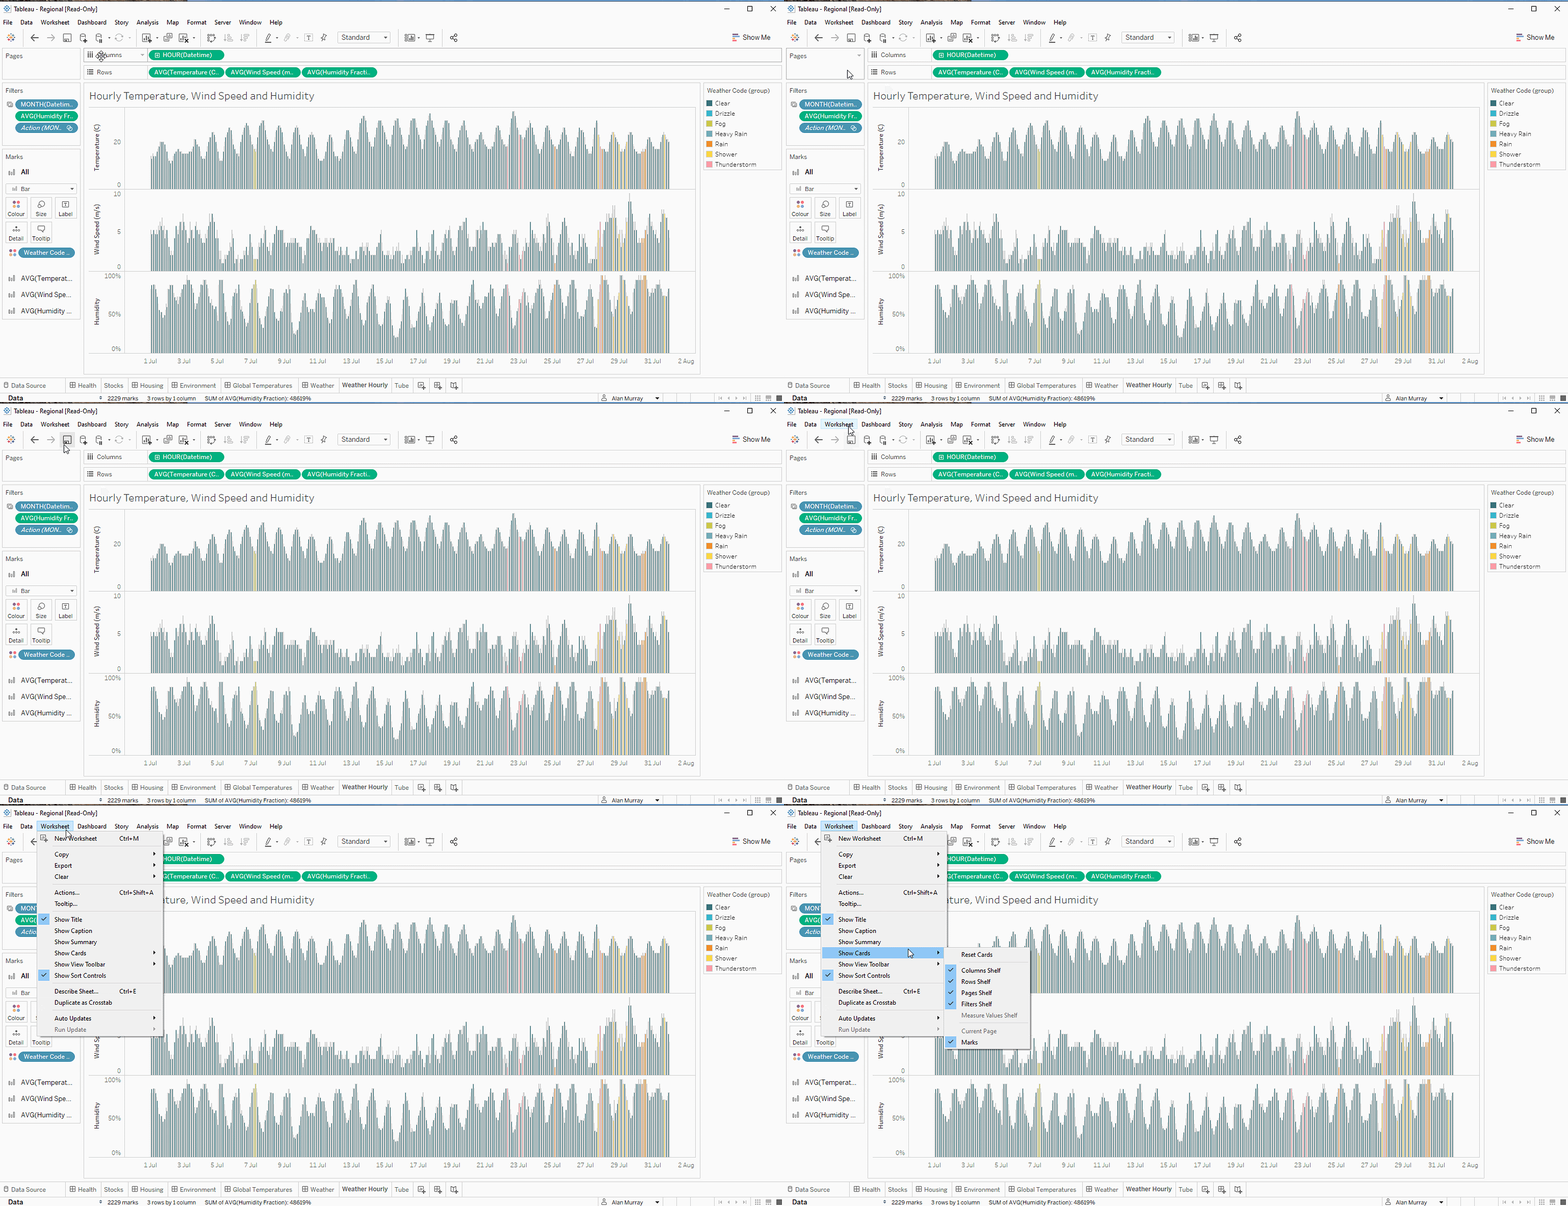
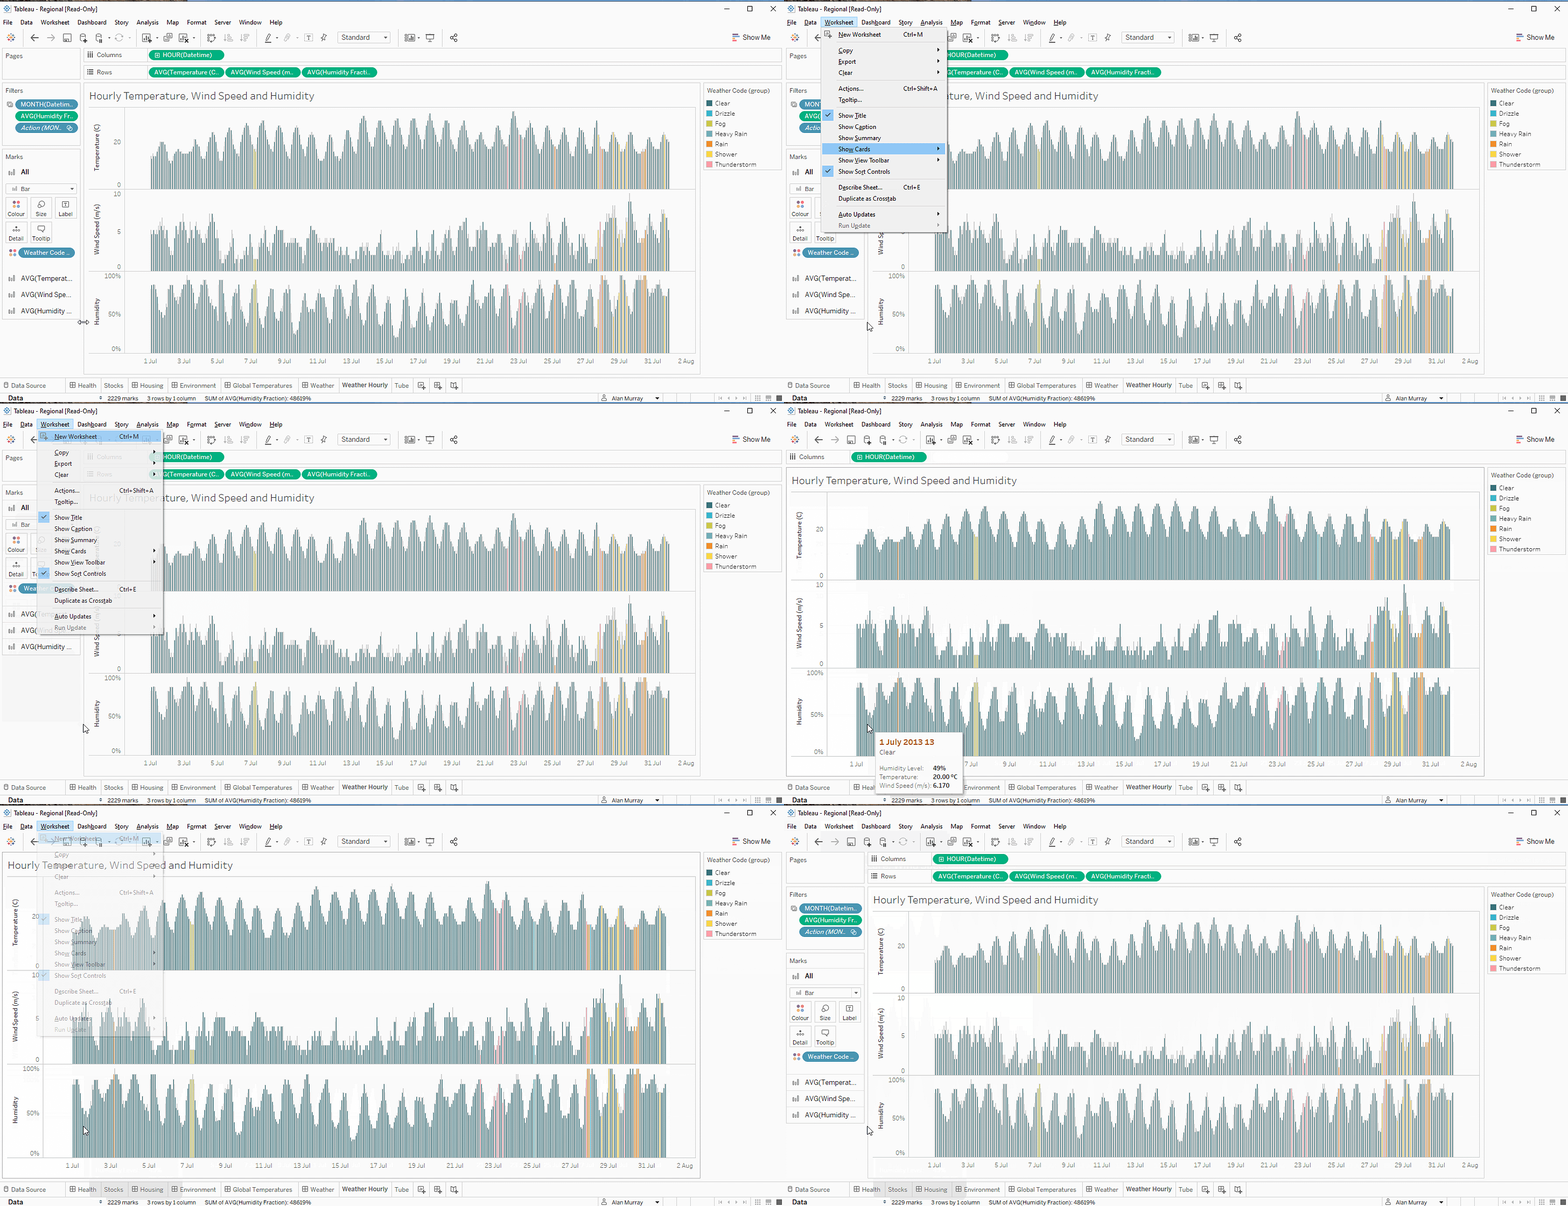
You can also customise which cards you see, for a really minimal view on a small screen you can hide them all and essentially have a full width sheet on screen! Simply go to Worksheet > Show Cards and Select what you want to show/hide. You can also do this with the show cards icon just next to the full screen icon. (You can move the cards around if you wish too, we’ll save the for another day though):
Pro Tip: Use the shortcut keys to quickly access the show/hide menu.
If you press Alt you should notice each of your menu items gets an underscore, clicking the corresponding letter takes you into that menu or performs that action. Here are some quick shortcuts to hide all your cards (press each key in sequence, not together)
Alt, w, w, c - Hide the columns card.
Alt, w, w, r - Hide the rows card.
Alt, w, w, p - Hide the pages card.
Alt, w, w, f - Hide the filters card.
Alt, w, w, m - Hide the marks card.
Alt, w, w, d - Reset the cards (show all).
Recommended Reads
This week I’ve got seven recommended reads for you including some inspiration from the Iron Viz student edition winners, tips on using containers and reference boxes, using map layers and successfully translating planning sessions into effective dashboards.
Iron Viz - Student edition winners
Bergen Schmetzer | Jan 21, 2021| Tableau Blog
Check out the three winners of the student edition of the Iron Viz competition for some excellent inspiration from upcoming Tableau talent!
https://www.tableau.com/about/blog/2021/1/tableau-iron-viz-student-edition-winners
A step by step guide to containers
Sadiya Girach | Jan 15, 2021| The Data School Blog
Containers are a great way of creating simple and clean layouts in Tableau, here Sadiya from The Data School gives us a step by step guide to using containers in Tableau.
https://www.thedataschool.co.uk/sadiya-girach/containers-a-step-by-step-guide
How to compare previous n month average
Owen Barnes | Jan 08, 2021| The Data School Blog
Owen Barnes from The Data School shows us how we can create a comparison to previous periods when our data is dynamic, this is great when your data is volatile and you want to assess performance.
https://www.thedataschool.co.uk/owen-barnes/how-to-compare-to-previous-n-month-average
How to make reference boxes in Tableau
Jonathan Allenby | Jan 11, 2021| The Information Lab Blog
Reference boxes are an excellent way of focussing in on data within scatter plots, or for highlighting sectors and clustering of data. Jonathan from The Information Lab shows us how to make these here.
https://www.theinformationlab.co.uk/2021/01/11/how-to-make-reference-boxes-in-tableau-desktop/
Allow users to show and hide map layers in Tableau
The Information Lab | Jan 15, 2021| The Information Lab Blog
https://www.theinformationlab.co.uk/2021/01/14/allow-users-to-show-and-hide-map-layers-in-tableau/
Creating customer UIs with map layers
Marc Reid | Jan 13, 2021| Datavis
https://datavis.blog/2021/01/13/creating-custom-uis-with-map-layers/
Sketching a successful Tableau whiteboard & Turning whiteboards into useful Tableau dashboards
Eric Parker & Kirk Olson | Jan 7-14, 2021| OneNumber
Last week I shared OneNumber’s guide to successful Tableau whiteboarding session, Eric and Kirk have since shared two further parts on this and look at successful elements for sketching a Tableau whiteboard and turning those whiteboards in useful dashboards.
https://onenumber.biz/blog-1/2021/1/4/seven-elements-of-sketching-a-successful-tableau-whiteboard
Tableau Career Paths
This week I’m pleased to include our first featured Tableau Career path!
This week we learn about Jared Flores’ a Senior Analyst at Brinks Home Security in Dallas, Texas who has been using Tableau for 4 years.
If you’d like to share your story for a future edition you can share your story here.
How did you first start using Tableau?
I started out as a warehouse worker with IBM Cloud using Excel daily to count inventory. There was a lack of automation in repeated tasks, so I began reading books to learn VBA and create useful tools. When leadership noticed I was promoted to a lead. I noticed the power of data so I picked up as many books as I could. Eventually I was managing Inventory teams internationally and needed data more than ever to understand how my teams were performing and how to communicate that to my leadership.
This is when I was introduced to Tableau and it completely changed the game for me. I began reading books, blogs, and forums to increase my skillset. Being in a setting where Tableau was new to the organization and experimental also allowed me to learn and even make mistakes without impacting critical functions. I was fortunate enough to have real data to work with as I learned, which I know is not always the case so I took advantage of it as much as I could.
How did you arrive at your current role?
When I felt like my organization didn’t truly see the value that visualizing data could bring, I began to search for a new opportunity. I applied for a Senior Analyst position at Brinks Home Security, and fortunately they were all-in with Tableau. Today, I build dashboards for VP’s and SVP’s and help guide the Service Delivery BI Team towards stepping outside of the “Show-Me” box.
What does a typical week look like in your job?
Typically after requirements gathering for a project, I’ll write down some techniques I know that might be useful, Then I’ll research other Ideas or techniques that I might be able to utilize. These all come together during the initial design and UAT process and so far, every new dashboard has helped the team learn how to do something new in Tableau, and brought excitement to stakeholders to see that their investment in data visualization is bringing value.
What do you like about your job, and what else would you like to do?
I love everything about my job. Making an impact with data that brings about positive, efficient process change has become my passion. Tableau changed my life and I wouldn’t be here without it. As far as where I go from here, I would love to establish a Tableau Center of Excellence at Brinks to spread the knowledge to all consumers and practitioners in the company.
What one piece of career’s advice would you give someone working with, or starting out with Tableau?
Get involved with the #datafam ASAP! Even though this is year 4 of my Tableau journey, I barely took the leap in December. I wish I would've joined much sooner because since I got involved my knowledge and skillset has increased exponentially.
Where can Tableau Tea Break readers find out more?
I write about Tableau on my blog whattheviz.com, you can view my Tableau Public profile at https://public.tableau.com/profile/jared8766#!/ or follow my on Twitter @VizWhat
Tableau Job Opportunities
This week I’ve expanded the job opportunities section and bring you 30 Tableau related jobs, focussing on Europe this week - next week I’ll focus on a different region. There was also an interesting Reddit discussion recently on demand for Tableau Developers which is worth a read for some interesting insight into Tableau jobs.
Europe
Senior Business Intelligence Manager - JLL - London or Dublin
Operations Performance & Analysis Manager - EasyJet - Luton, UK
Commercial Analytics Manager - Johnson & Johnson - High Wycombe, UK
Data & Analytics Strategist, Vice President - JP Morgan Chase - London, UK
Head of Data Analytics & Insight - Kaplan International - London, UK
Senior Business Intelligence Developer - Trustpilot - London, UK
Senior Analytics Specialist - Precis Digital - Stockholm, Sweden
Customer Data Insights & Strategy Lead - HP - Geneva, Switzerland
Senior Business Analytics Manager - Hotjar - Remote, EMEA
Asia Pacific
Data & Systems Analyst - Unilabs - Manila, Philippines
Americas
Senior Tableau Developer - Consumer Goods - Ohio, US
Thanks for reading, if you enjoyed the issue help us grow by sharing with your colleagues and social networks:
See you in the next issue for more Tableau goodness!
Alan @ Tableau Tea Break


