TTB #6: How to Tableau, top tips and job opportunities
This week we introduce our new How To Tableau... series starting with creating date scaffolds, as well as bringing you our latest recommended reads, top Tableau tips and job opportunities.
Welcome to the first Tableau Tea Break of 2021! I’ve added a few new items this year including starting our regular How To Tableau series and looking at Tableau job opportunities and career paths, don’t forget to tell us what else you’d like to see in our short survey - it’ll be open until the end of January.
This week we’re taking take a look at:
How to create ‘date scaffold’ in Tableau when you want to look at how many items were active per day, week, month etc.
How you can make Tableau Public dashboards which automatically update.
Preview of next weeks How To Tableau: Creating a simple custom date picker.
My Tableau tips of the week and recommended reads including UX design hacks, how to connect with the Tableau community and top tips for successful Tableau whiteboarding sessions.
10 Tableau job opportunities from around the world.
Enjoy the issue!
How To Tableau… #1 Date Scaffolding
Starting in 2021 I’ll be bringing you a ‘How To Tableau…’ in each issue focussing on something I’ve been asked for help with recently, or something I see often. This week I start with something that comes up pretty often which is how do you create something like this in Tableau?
It’s a pretty typical request where you have items with a start and end date and you need to show how many, or the value, of these items were open each day, week, month etc.
These could be orders, sales opportunities, support tickets or anything with a start and end date. The main challenge with Tableau is creating the list of dates and working out the values for each day but it’s pretty easy once you’ve done it once, here’s how:
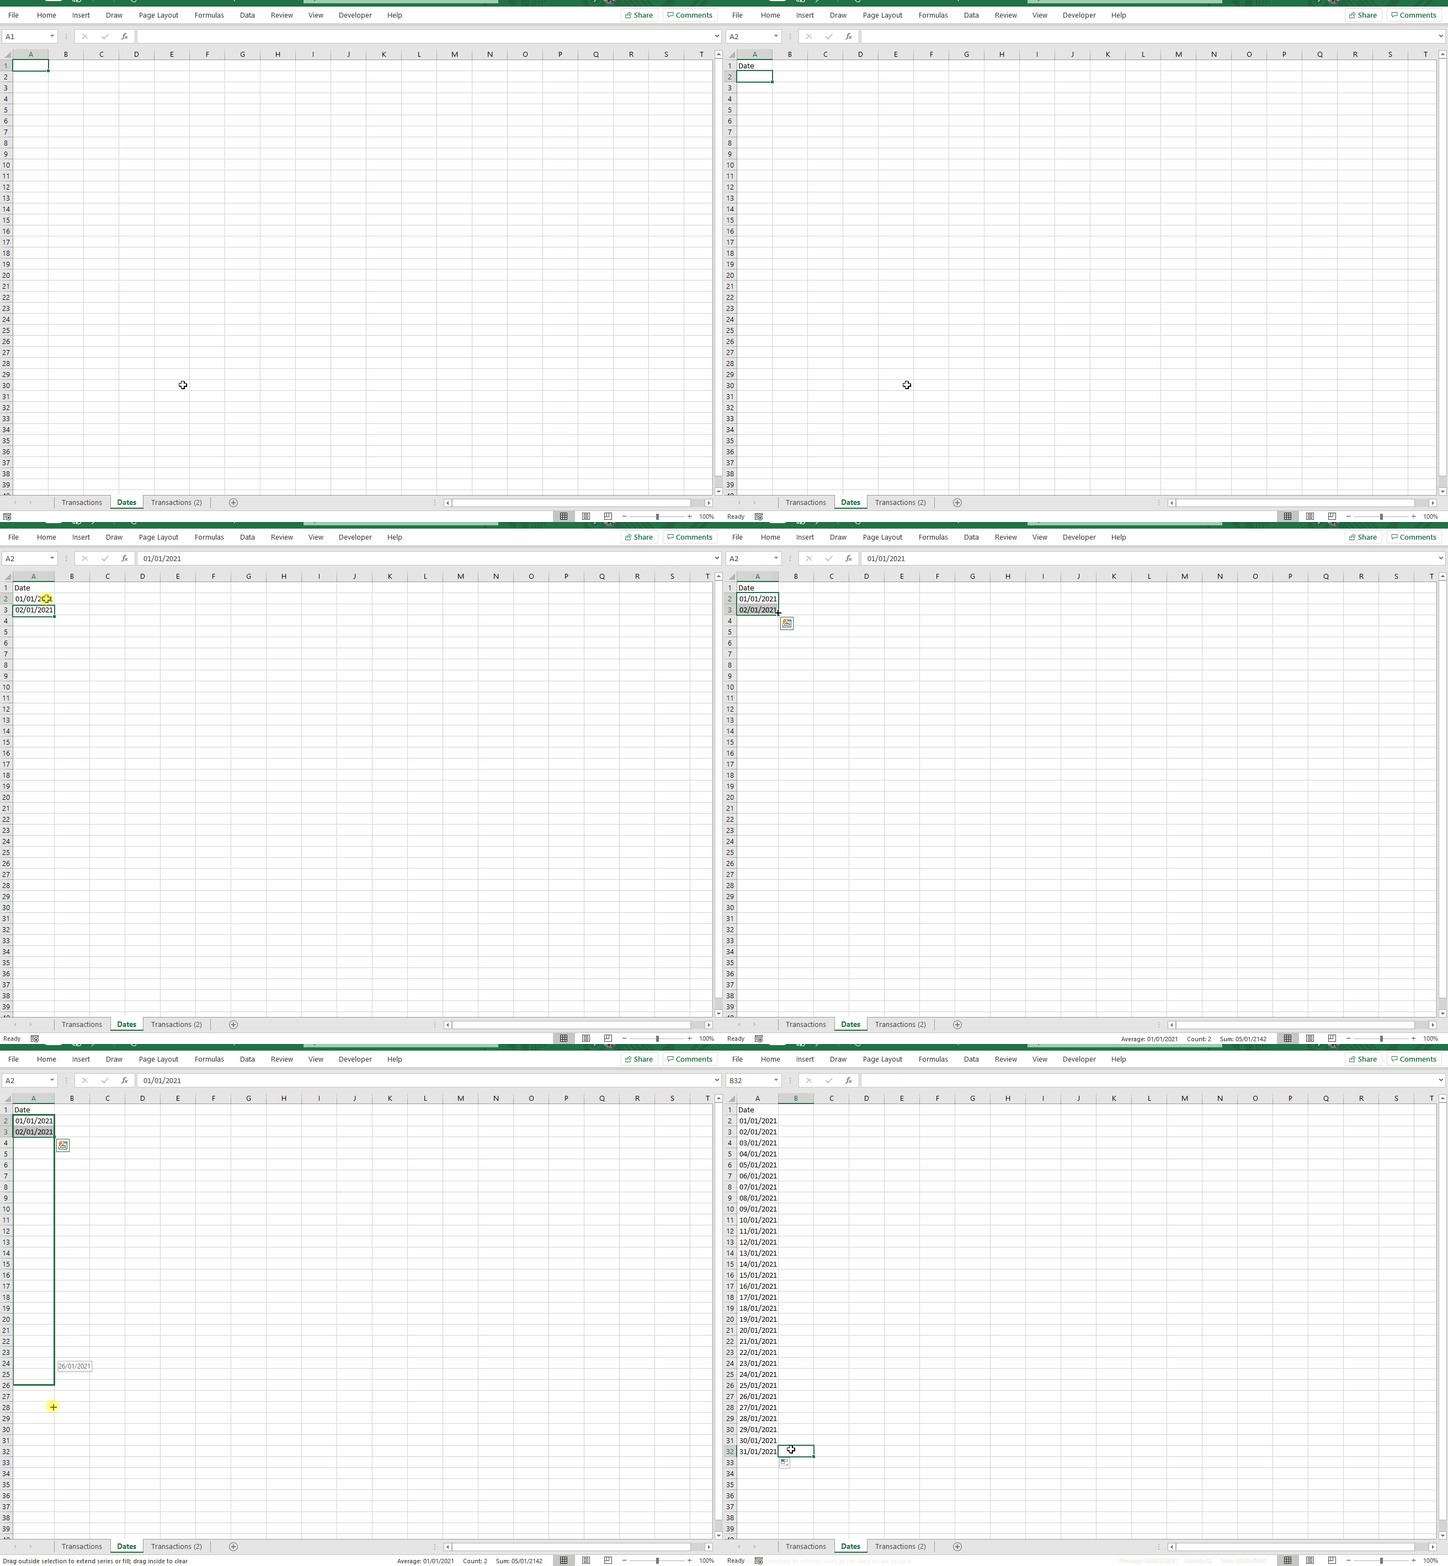
Step 1: Create a ‘date scaffold’ file with the required dates in it
This is simply a list of the dates you want to look at, here we do it for days in Jan 2021:
Step 2: Connect to the file and join your data to the date scaffold
Connect to the file you created above in Tableau, and then bring your data in too. The key part here is when you join your data to your date scaffold you want to create the join relationships to be Date >= Start Date and Date <= End Date, this will create a row for each item for each date it was ‘open’.
Step 3: Bring your dates into view and create the chart
Once you’ve joined the data create your chart by bringing the Date from your scaffold file onto the Columns card (make sure to choose the green continuous option for the date level you want, in our case days) and then bring on the value you want:
And that’s it done!
We’ve put together a more detailed guide which you can find here: How to Tableau... Create Date Scaffold
Next Week: How To Create a Date Picker
Next week we’ll show you how to make a simple date picker in Tableau, in the meantime check out this post on how to embed an airbinb style date picker into a Tableau Dashboard
Quick How To: Automatically update Tableau Public dashboards
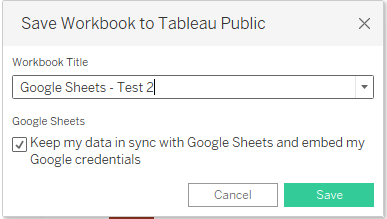
Did you know it’s possible to have your Tableau Public data update automatically? If you use Google Sheets as your data source you’re given the option to auto update every 24 hours as below!
At the bottom of your Tableau Public Viz you’ll be able to see when the data was last updated and even request an immediate update:
This is a great way of creating a Tableau Public dashboard that you don’t have to re-publish every time you have new data. We use it for Top Tableau Blog Posts viz, as long as the data is updated in your Google sheets file it will auto refresh every 24 hours in Tableau Public without you having to do a thing.
Top Tableau Tips
Here are some of the top tips we’ve been using a lot this week:
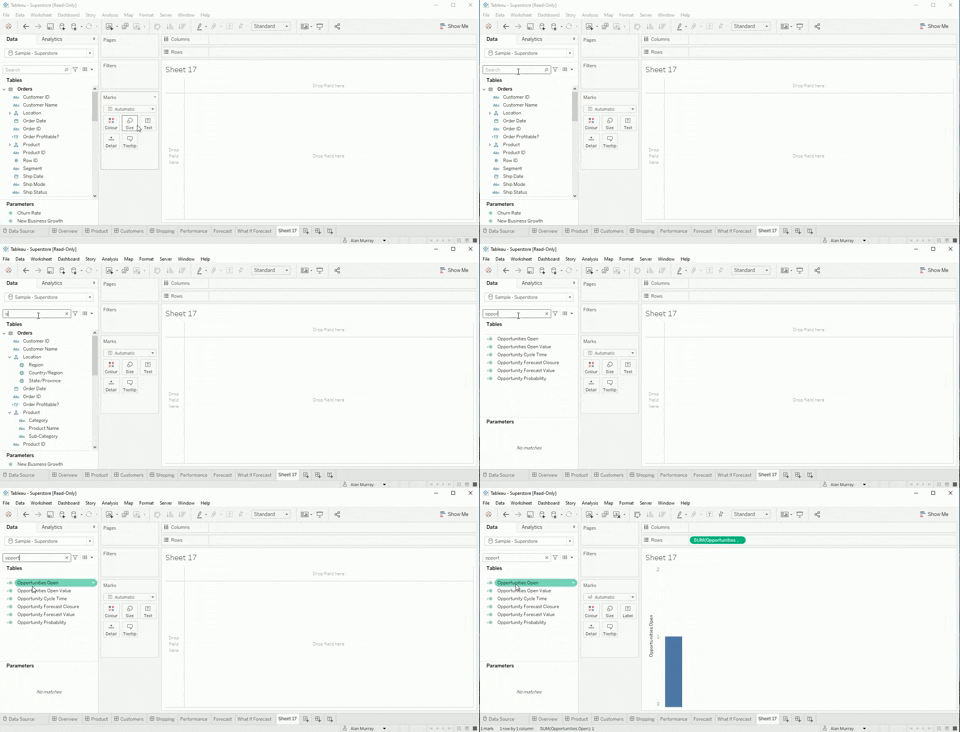
Use search to find fields
If you ever work with data from databases or systems that contain a lot of columns finding the fields you want can be a pain, I’ve been using the search a lot lately and trying to get out of the bad habit of just scrolling through!
This is particularly useful if you’re working on something that’s using measures or dimensions that have common names, for example here we’re just working with the opportunity fields and searching on them narrows down what we see:
Keep formatting when changing measures or dimensions
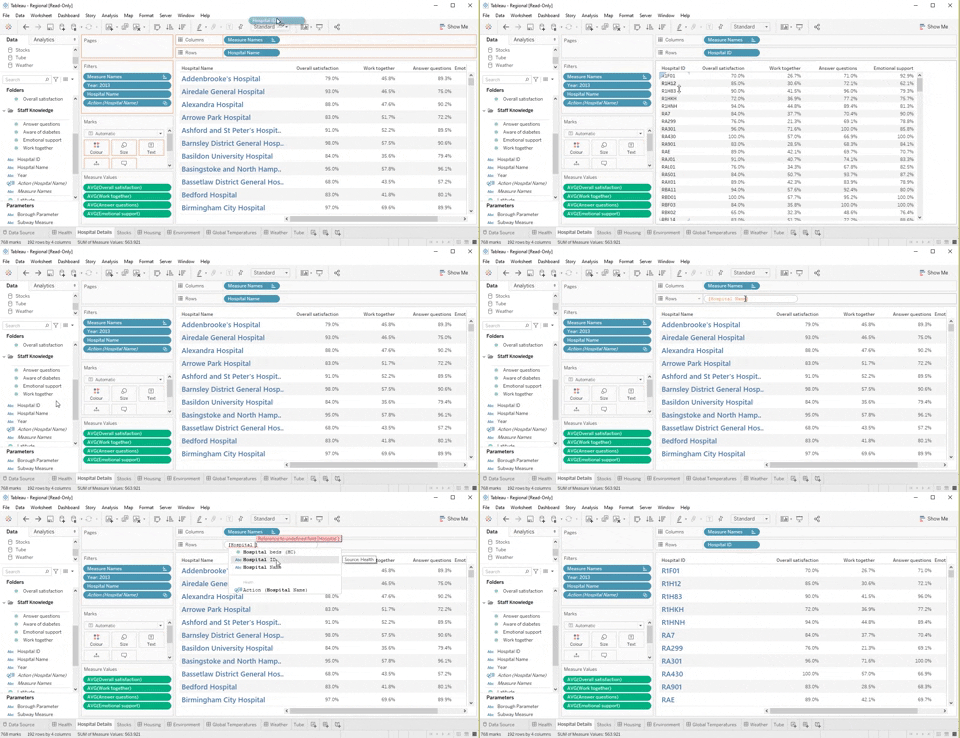
If you’ve done some formatting on a particular dimension or measure and then need to change it out for another one you may have noticed you then have to re-do all of the formatting, particularly when working with tables.
Instead of replacing the dimension/measure, simply double click the pill in the relevant card and type in the dimension/measure you want instead, this will do the same but preserver any formatting you set:
Paste data directly into Tableau
Tableau doesn’t really publicise this much but there’s loads of things you can simply copy and paste into Tableau, for example you can copy calculated fields, sheets and dashboards from one workbook to another just by copying and pasting.
You can also actually paste data directly in from your clipboard without having to connect to a new file to, simply copy the data you want and paste it into Tableau and it will appear as a new data source!
Tips from elsewhere
@ZaksViz also shared his first 5 Tableau Design Tips on his Tableau Public profile, you can find the links to them on this LinkedIn post
Recommended Reads
Here we bring you our favourite blog posts and recommended reads from the past few weeks:
DataDev Bingo: Play with your skills and developer site
Geraldine Zinolli | Jan 5, 2021| Tableau Blog
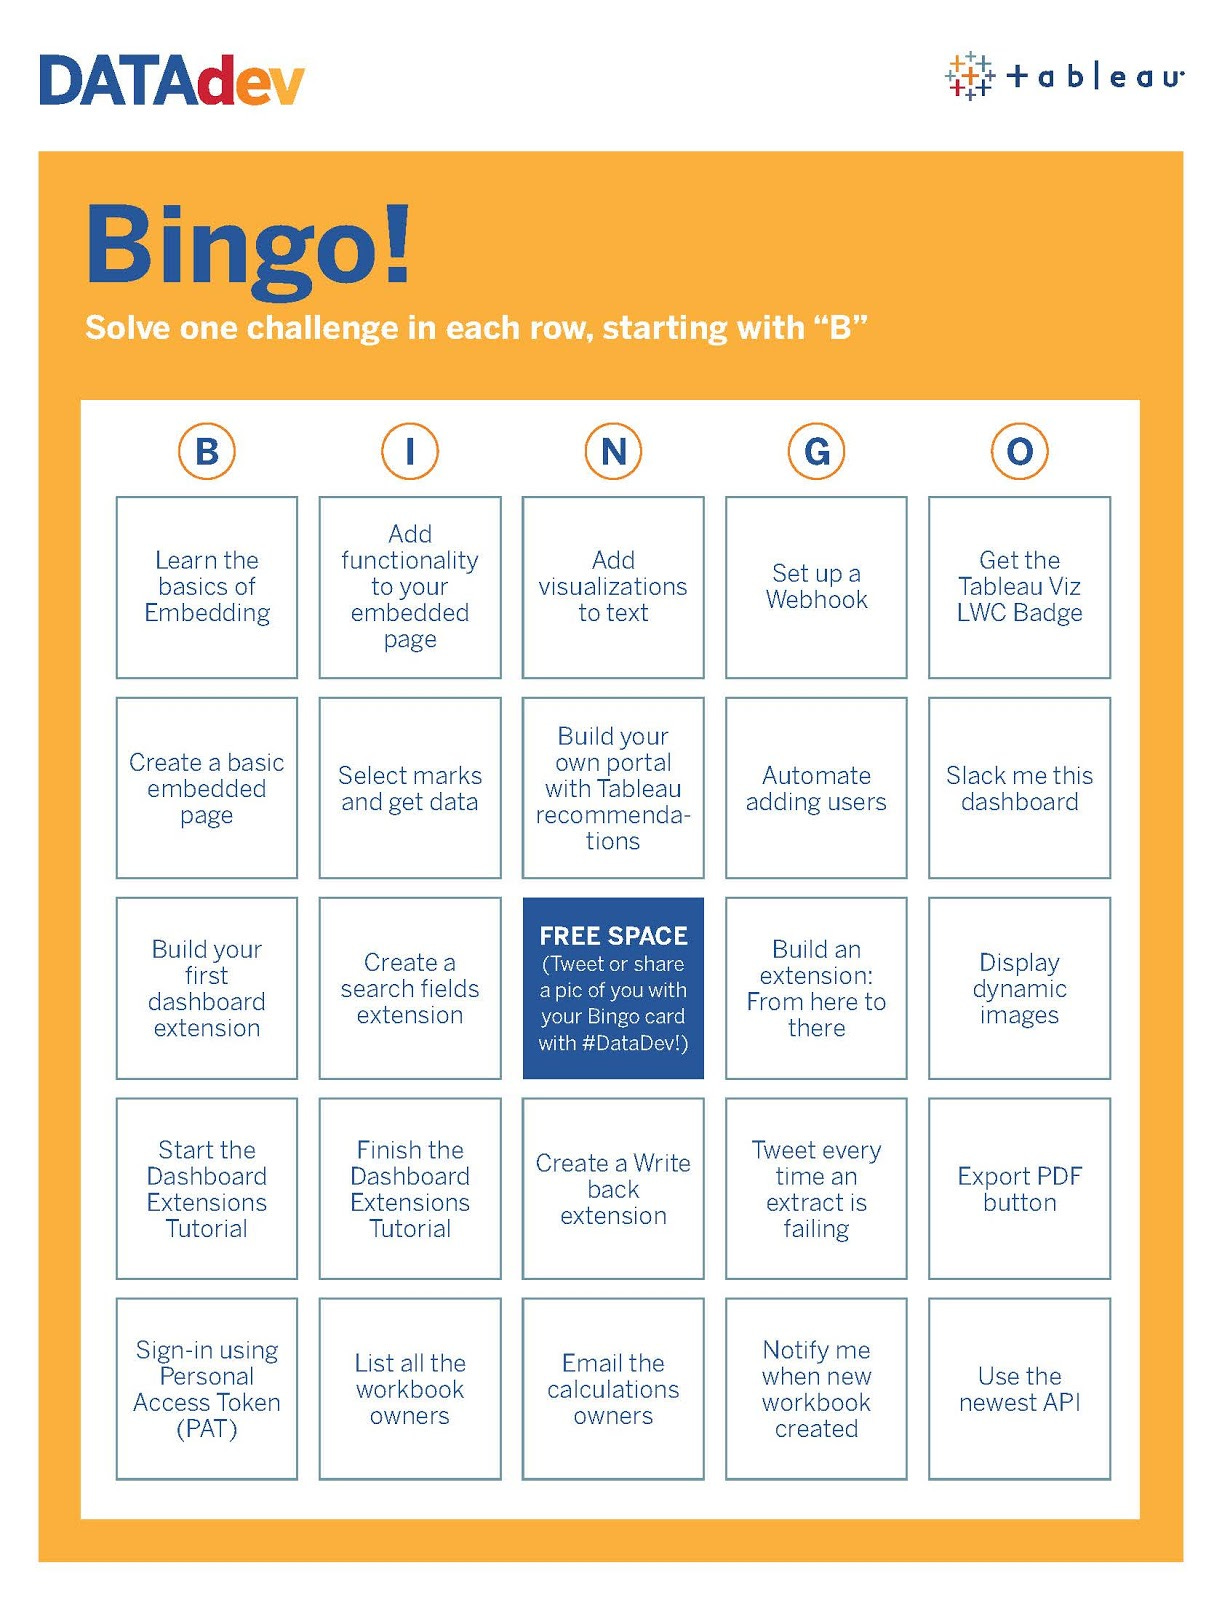
Geraldine Zinolli announced a bit of a revamp of the Tableau Data Dev program this week, part of which is the new Data Dev Bingo which gives you the chance to develop and practice your skills with 24 challenges from learning the basics to using the newest API.
tableau.com/about/blog/2021/1/datadev-bingo-play-your-skills-and-developer-site
Understanding PREVIOUS_VALUE in Tableau
Sebastian Deptalla | Jan 7, 2021| Interworks Blog
The PREVIOUS_VALUE function in Tableau can be really useful, particularly in finance where running or compounding calculations may be needed. However, it doesn’t actually do what you’d expect so this is a really great run down of what it is, what it can be used for and crucially what it doesn’t do!
interworks.com/blog/2021/01/07/understanding-previous-value-in-tableau/
Five Tableau UX Hacks for 2021
Keith Dykstra | Jan 5, 2021| Interworks Blog
Some great user experience and design tips in this post including using space efficient layouts, interactive sidebars, auto de-selecting of elements, using invisible shapes to remove distractions and including onboarding instructions for users.
interworks.com/blog/2021/01/05/five-tableau-ux-hacks-for-2021/
Why & How to Connect with the Tableau Community
Kevin Flerlage | Jan 4, 2021| The Flerlage Twins
Really useful advice in here on getting involved with the Tableau Community to take your Tableau skills to the next level and how to connect with the community. Spoiler alert: Get yourself on Tableau Public, Twitter & LinkedIn and connect and engage with fellow Tableau users!
flerlagetwins.com/2021/01/why-how-to-connect-with-tableau.html
Output to a Database from Tableau Prep
Tom Prowse | Dec 31, 2020| The Information Lab Blog
One of the limitations to using Tableau Prep at work was that it could only output to a file, as of Tableau Prep Builder 2020.3 the ability to output the data back to a database was introduced and this opens up a whole lot more possibilities for using Tableau Prep. Find out how it works in this post.
theinformationlab.co.uk/2020/12/31/output-to-a-database-from-tableau-prep/
Five Keys to Successful Tableau Whiteboarding Workshops
Kirk Olson | Jan 7, 2021 | OneNumber Blog
Two of my favourite tips for starting on any new project in Tableau are to always start with a pencil and paper (whiteboard and markers work too!) and to understand what questions you or your users are looking to answer from the project. This post offers some key tips and advice on making sure your planning sessions and workshops are a success.
onenumber.biz/blog-1/2020/12/30/3iwg29o6tlbjkr58qdw49r31ri71f2
Exciting Changes to #ProjectHealthViz in 2021!
Lindsay Betzendahl | Jan 4, 2021 | Viz Zen Data
A couple of weeks ago Lindsay announced some exciting changes to the project health viz community initiative in order to bring a more consistent structure and cadence as well as announcing the addition of Sean Miller to the project. We’re looking forward to seeing how this develops throughout 2021.
vizzendata.com/2021/01/04/exciting-changes-to-projecthealthviz-in-2021/
Tableau Job Opportunities
This week we bring you a look at 10 featured Tableau jobs we’ve seen advertised across the globe this year, even if you’re not looking for a job at the moment they give you an idea of the types of roles available and which companies are recruiting people with Tableau skills:
Senior Tableau Developer - RingCentral - Mandaluyong, Philippines
Tableau Dashboard Expert Developer - Devoteam - Riyadh, Saudi Arabia
Consultant Operations Transformation - CIBC - Ontario, Canada
If you’re interested in a job at Tableau you can also find there current job openings here: Tableau Careers - Current Openings
Tableau Career Paths
In the next issue we’ll be bringing you an insight into career paths in Tableau and data analysis/visualisation including insights into how people got started with Tableau, how they got to the job they’re doing now and what that job involves.
If you’re interested in being featured drop me an email at alan.m.murray@icloud.com
Thanks for reading, if you enjoyed the issue help us grow by sharing with your colleagues and social networks:
See you in the next issue for more Tableau goodness!
Alan @ Tableau Tea Break






Hi Alan, thank you for your post! Do you know if it's possible to embed a Tableau Public dashboard into Substack? I've tried - and failed... Thank you!
Hi Alan, thank you for your post! Do you know if it's possible to embed a Tableau Public dashboard into Substack? I've tried - and failed... Thank you!