Tableau Tea Break - Issue 3 - 15th November '20
Welcome to the 3rd issue of Tableau Tea Break. This week we share our new top tableau blog posts visualisation, bring you our recommended reads & share our Tableau Viz of the Week and Tip of the Week.
Welcome to this week’s issue of Tableau Tea Break, we’ve got lots of great content for you this week including:
Our new tableau public top blog posts visualisation.
7 recommended reads including how to’s, tutorials and design tips.
Our Tableau Tip of the Week and Viz of the Week.
Tableau news including the upcoming 2020.4 release and how you can be an earlier tester for the new collections feature in Tableau Server & Online.
Keep track of the top Tableau blog posts
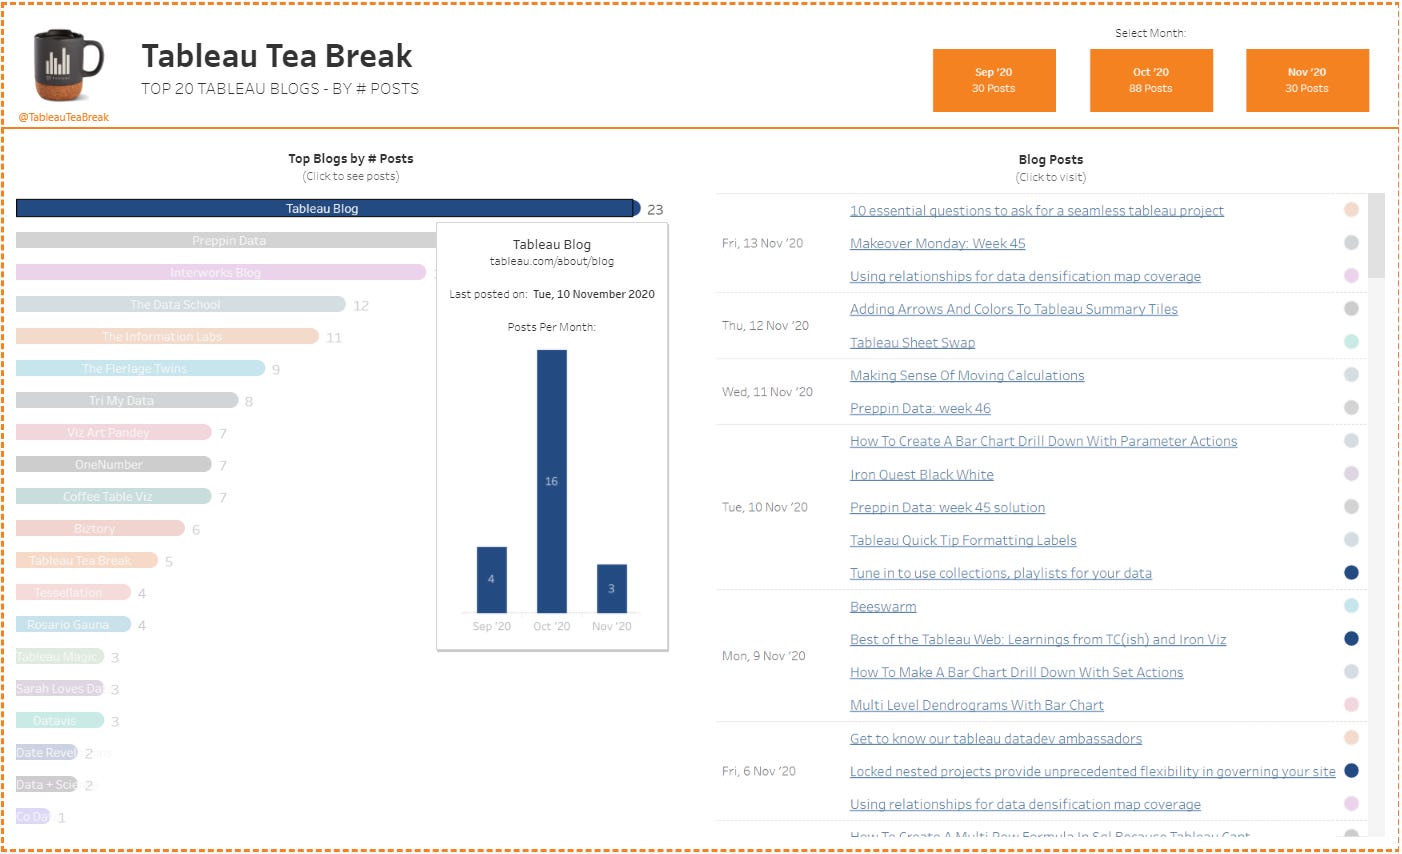
If you’re a regular to Tableau Tea Break you’ll have probably seen our ultimate list of active Tableau blogs which we update every month. We’ve now taken this a step further and are delighted to share our league table of Top Tableau Blogs available now on Tableau Public.
We’ll be updating this regularly so you can:
See all the latest Tableau posts in one place and click straight through to them
Keep up to date with all the latest posts and see when new content is posted
See how active your favourite blogs are, how often they’re posting and access them all from one page.
Recommended reads this week
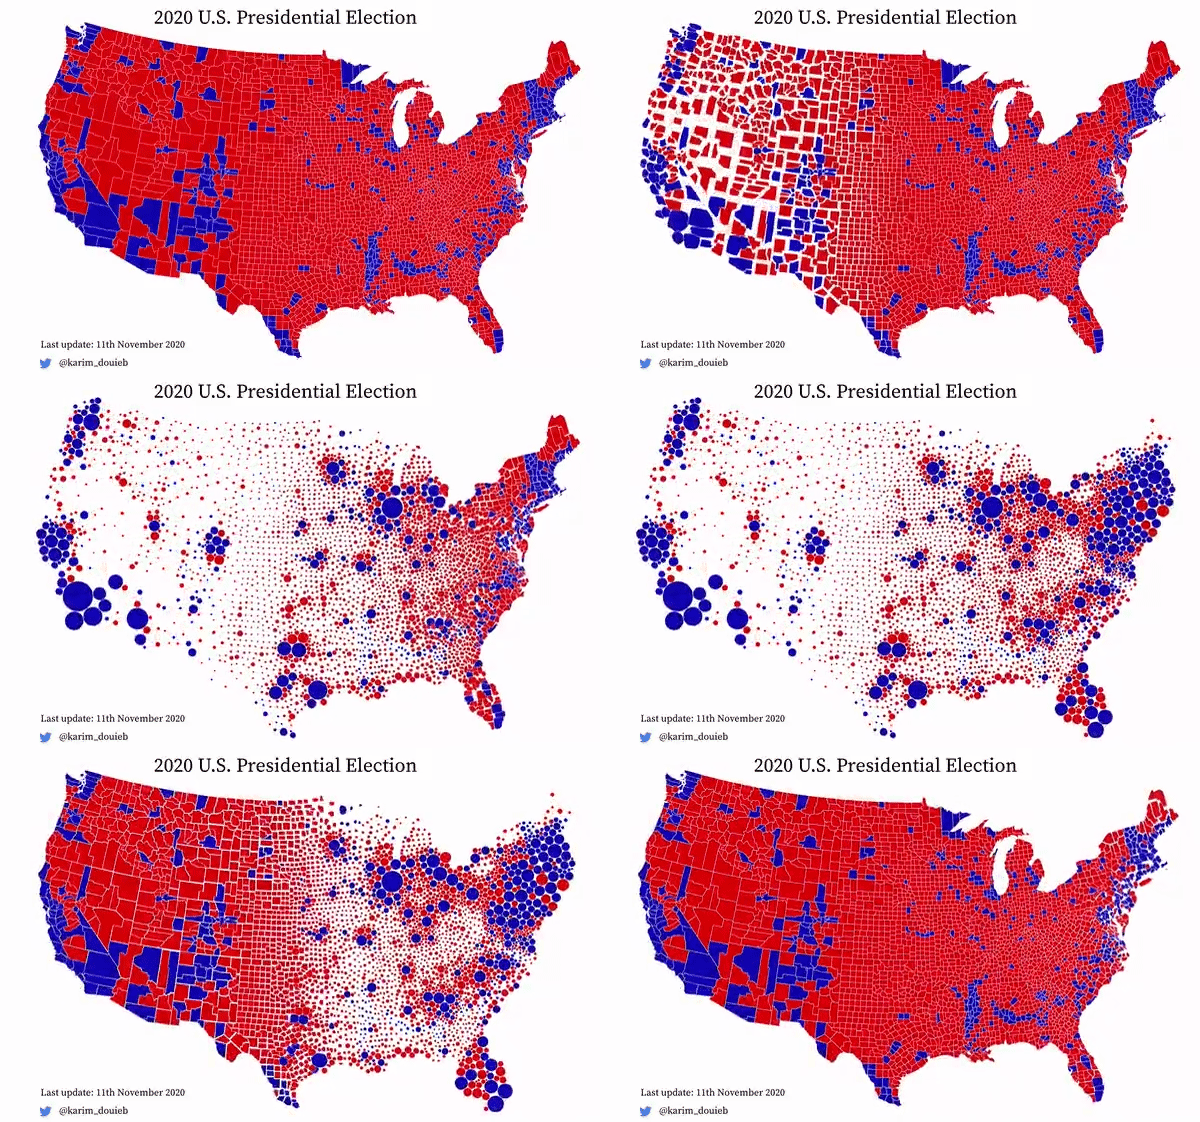
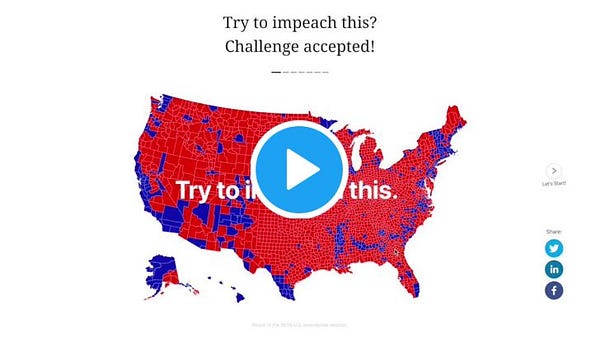
Inspiration: Land doesn’t vote - people do
By Karim Douieb | @karim_douieb | linkedin.com/karim-douieb/
This is a great demonstration of the importance of making sure your charts represent your data fairly. This is a particular challenge with maps since the size of each section on the map isn’t representative of the data underneath it.
Another important point to consider is how easy this is for viewers to understand. The revised output with bubbles is great for showing the geographical spread of votes, however if you were trying to visualise the end results it’s not obvious whether the larger blue bubbles outnumber all of the smaller red ones (admittedly that’s not what this is trying to do though).
Check out the gif and the thread below:

How To: Swap charts with a parameter
By Marc Reid at datavis.blog | @marcreid
This is an interesting take on letting users select which sheets they want to see on a dashboard. While this technique is nothing new Marc shows us how to allow users to scroll through different charts using a minimal interface and ‘scrolling’ buttons.
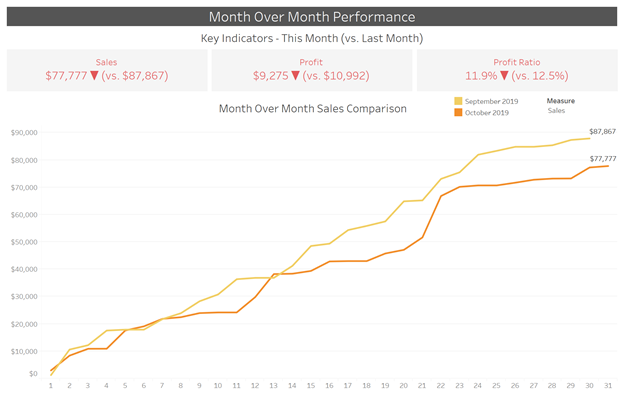
How To: Adding arrows and colours to summary tiles
By Eric Parker at OneNumber
Here’s a great tutorial from Eric on how you can make your headline numbers stand out on a dashboard by adding arrows or colours to demonstrate trends.
Chart Tutorial: Creating a basic Beeswarm plot
By Ken Flerlage at The Flerlage Twins | @flerlagekr
This is a great way of comparing the distribution of data across a number of dimensions or categories. Ken shows us how to build the basic beeswarm plot above, which can then be developed further into more advanced charts if required.
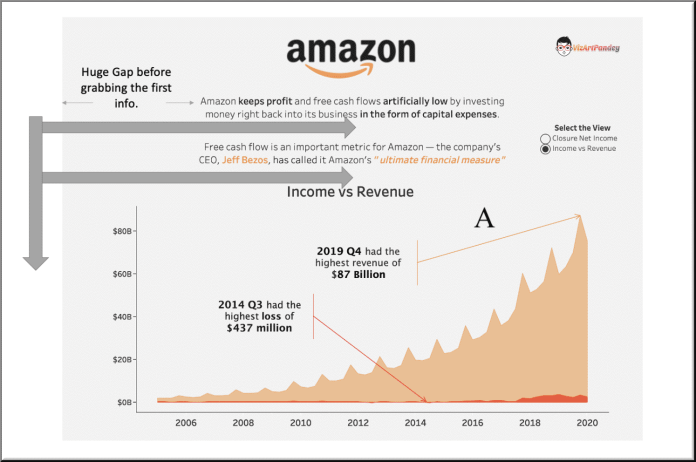
Knowledge: 5 Human-Computer Interaction principles for an amazing data visualisation
By Mala Deep Upadhaya at VizArtPandey
This is a fascinating read and a gives a great insight into how we read screens and information. It gives lots of ideas to help understand how to design and lay out our dashboards and visualisations.
Community: Get to know our Tableau data dev ambassadors
By Andre de Vries at The Information Lab | @andre347_
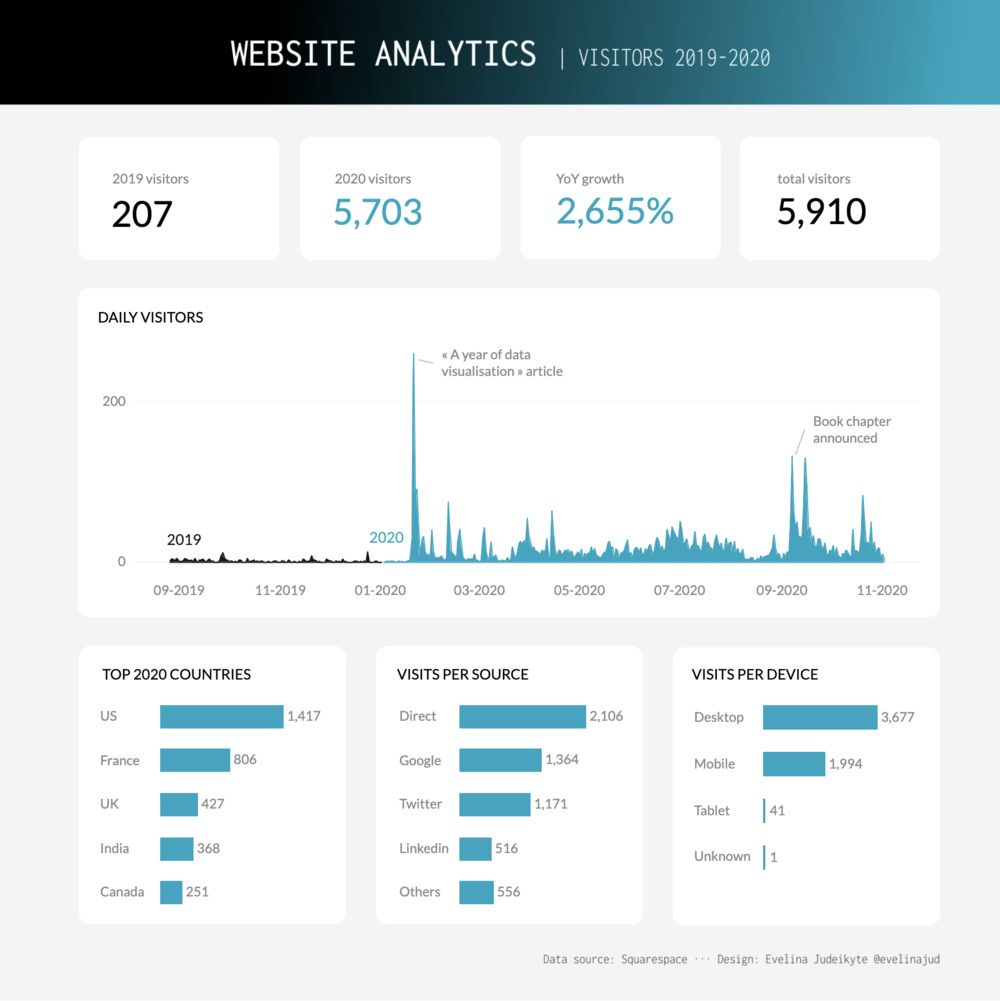
Design: Three design principles for more effective dashboards
By Evelinea J | @evelinajud | linkedin.com/evelina-judeikyte
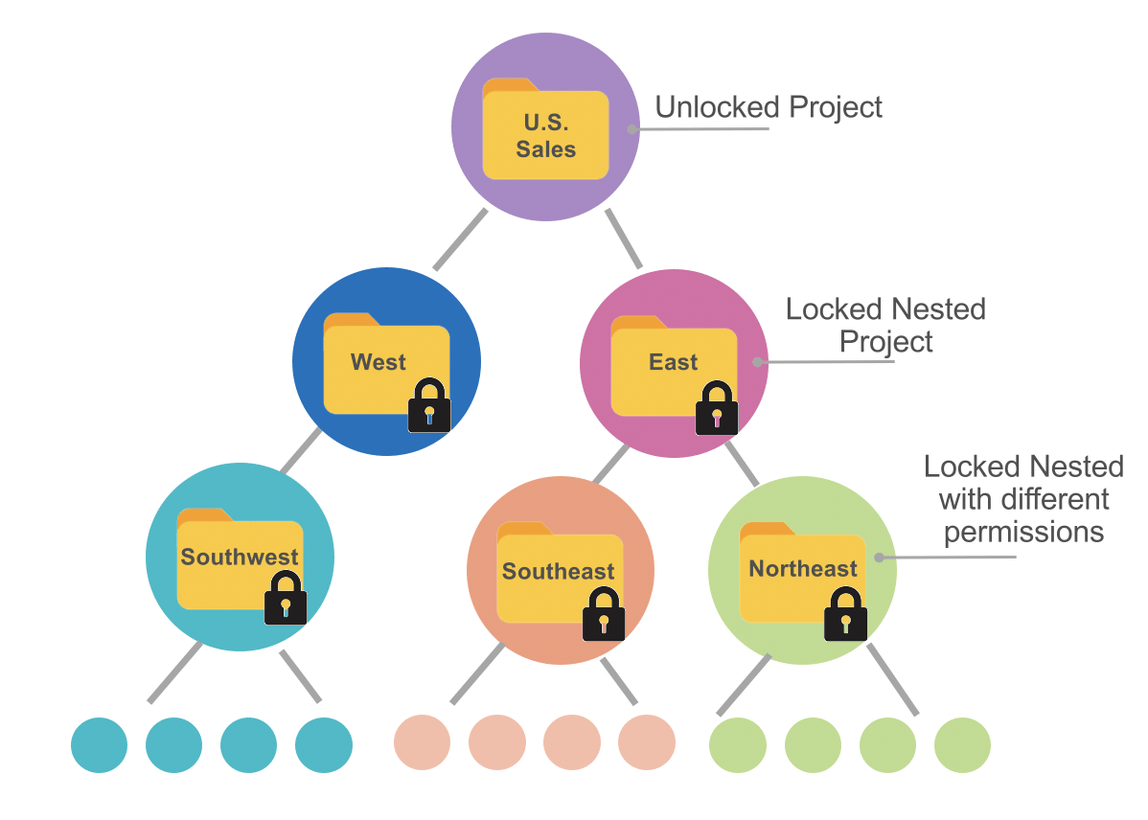
Tableau Online/Server: Locking permissions for nested projects
By Mark Shulman at Tableau
Tip of the week
Preserving formatting when changing dimensions
This one saved us a lot of work this week! If you drag a new dimension to replace an existing one unfortunately you lose your formatting. A quick way to avoid this is to simply double click the existing dimension in the rows card and type in the one you want to replace with - this keeps your existing formatting!
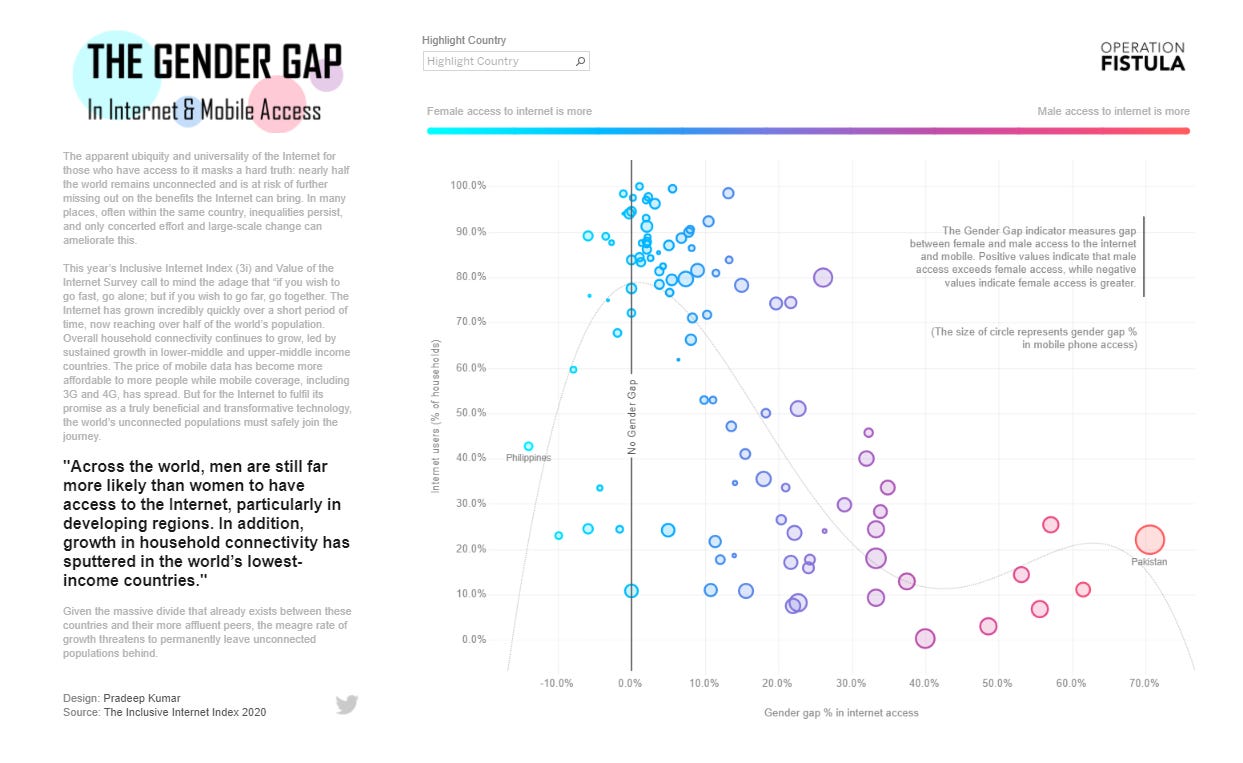
Viz of the week
The Gender Gap by Pradeep Kumar
Tableau news
Tableau 2020.4 is currently in beta and due for release soon, check out what’s included
Collections will soon be introduced to Tableau Server/Online to help organise your content. Sign up to become an early user
November’s edition of Best of the Tableau Web was released this week.
We hope you enjoyed our 3rd issue of Tableau Tea Break. Look out for issue 4 next week and if you liked what you read subscribe below:
If you have suggestions or requests for future issues get in touch @TableauTeaBreak or linkedin.com/alan-m-murray/
Thanks for reading,
Alan @ Tableau Tea Break.


