Tableau Tea Break - Issue 1 - 22 Oct 2020
The 1st issue of our weekly newsletter updating you on everything happening in the Tableau universe and community this week.
Welcome to the very first edition of our weekly newsletter, read on to find out what’s been going on this week, recommended blog posts, inspiration and all things Tableau!
Tableau Conference
It’s hard to believe it’s already 2 weeks since TC2020, time is flying at the moment! On the plus side you can now watch replays of any of the 309 sessions on the conference website. If you missed any you can find them at tc20.tableau.com/episodes
You can also check out what was on in our interactive TC2020 schedule viewer by clicking the image below:
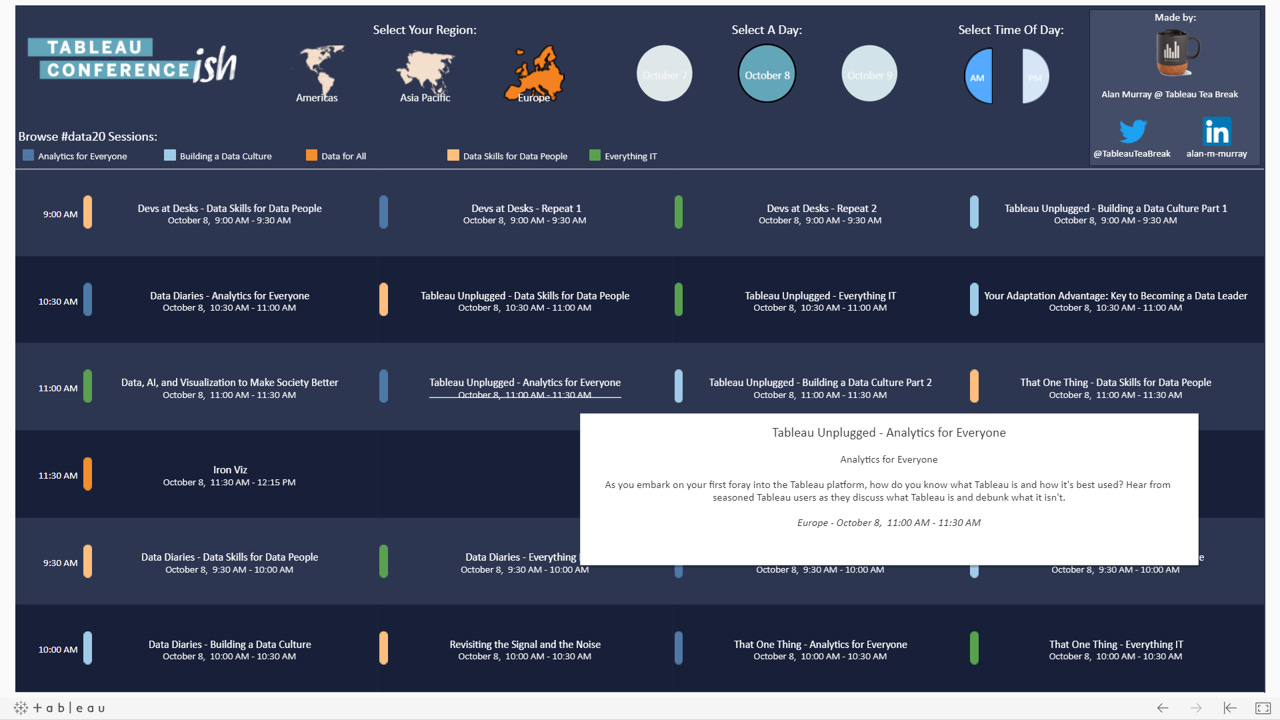
Here are some highlights and write ups on TC2020 worth checking out too
Devs at desk showcased some of the new Tableau functionality coming soon, check out this roundup of the highlight of devs at desks from Interworks.
Sarah Bartlett from sarahlovesdata talks about her tableau conference-ish highlights here
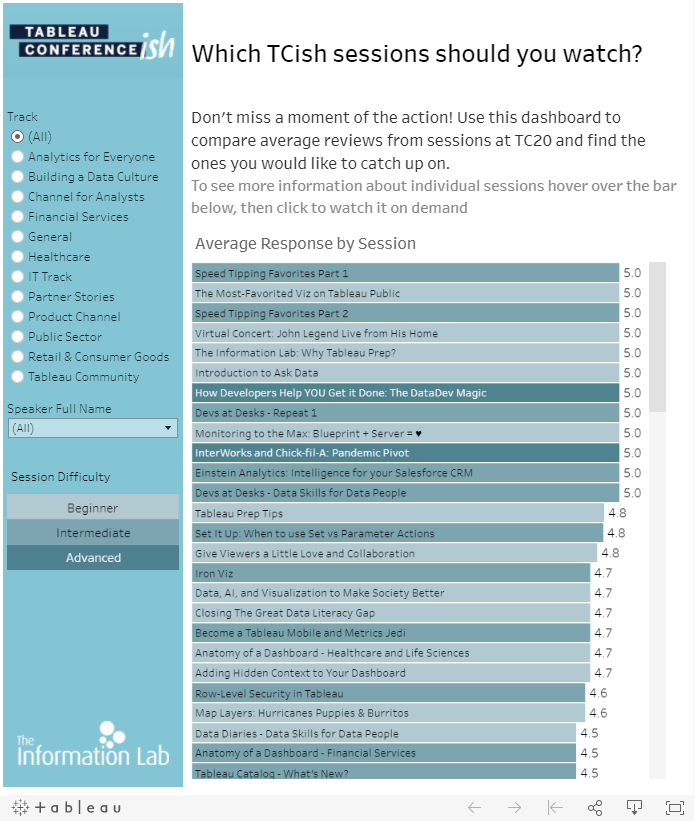
The Information Labs have produced the viz below showing the best rated sessions from TC2020:
Recommended Reads This Week
We take a look through the Tableau universe and community to see what’s been going on and pick out some of our highlights.
Creating a Tableau Server to Slack notification
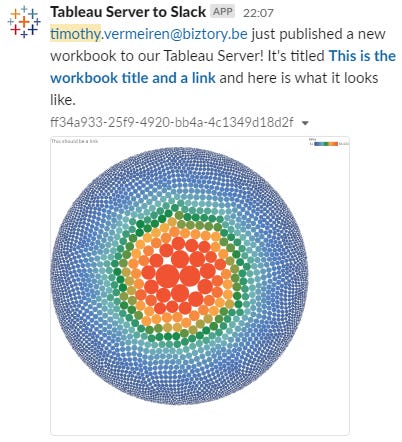
We’ve seen quite a lot of activity on the technical dev side of Tableau in the last year with the data dev community and the new data dev ambassador roles. Here Biztory take a look at automatically posting to Slack when a new workbooks is published to Tableau Server. It’s quite a technical post but worth a read to learn about what’s possible:
Write-back for everyone: Parameter Query Language
Sticking with the technical theme for a moment, Rosario Gauna & Klaus Schulte show us the concept they’ve come up with for being able to create and write data directly in Tableau, using only Tableau in-built functions (no extensions or writing to external data stores). This could be a game changer and is well worth checking out
Increasing Tableau server adoption
Interworks five part series on increasing Tableau server adoption has some great tips if you’re using Tableau in an enterprise setting, the final part provides a rundown of five ways to earn quick wins.
Data school tips
The Information Lab’s data schoolers are always posting lots of useful tips, tricks and hints on using Tableau and on what they’ve learned, this week these 3 stood out:
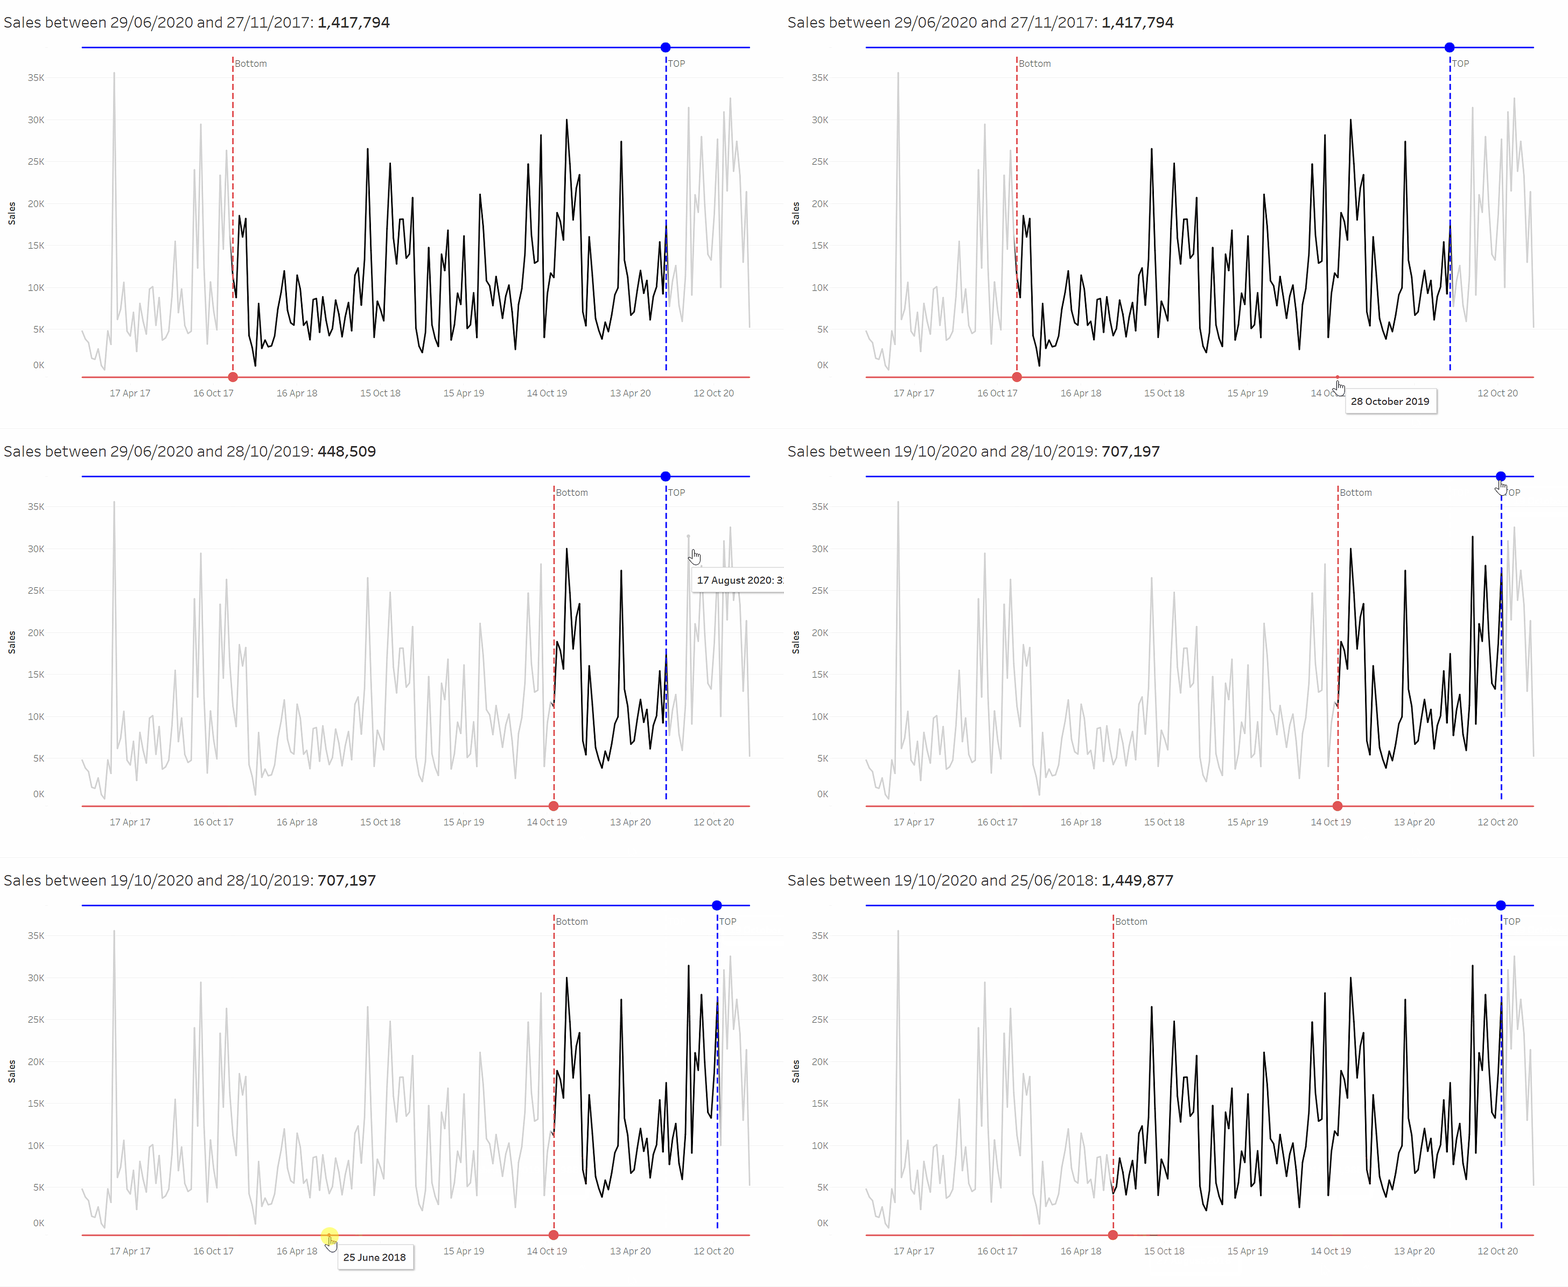
Lukas Jennings shows us how to create a dynamically shifting data slider in Tableau.
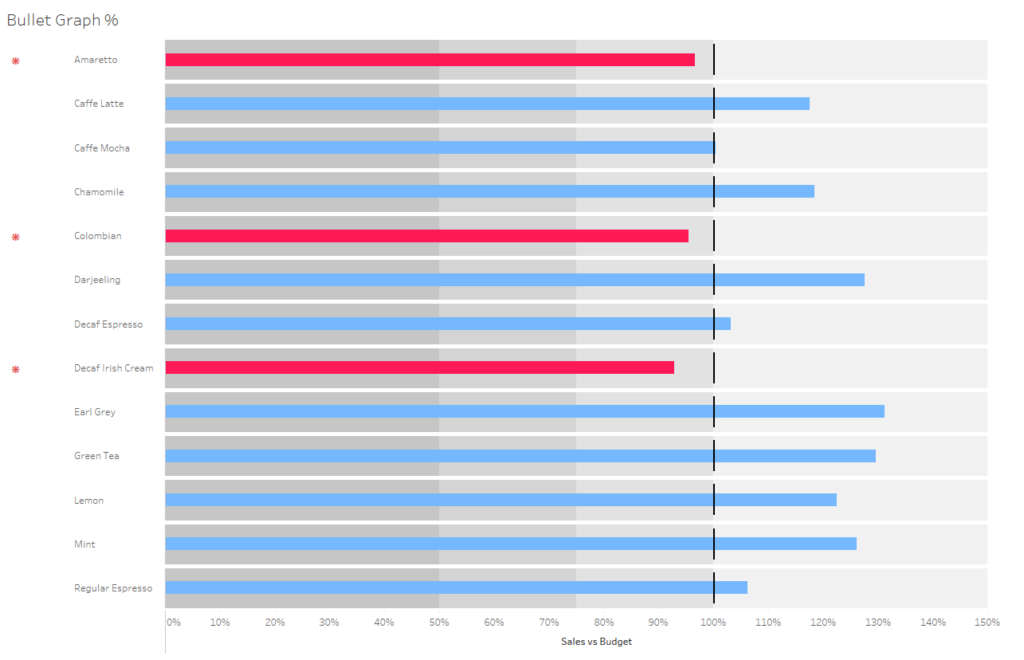
Alex Hirst shows us how to build bullet graphs in Tableau.
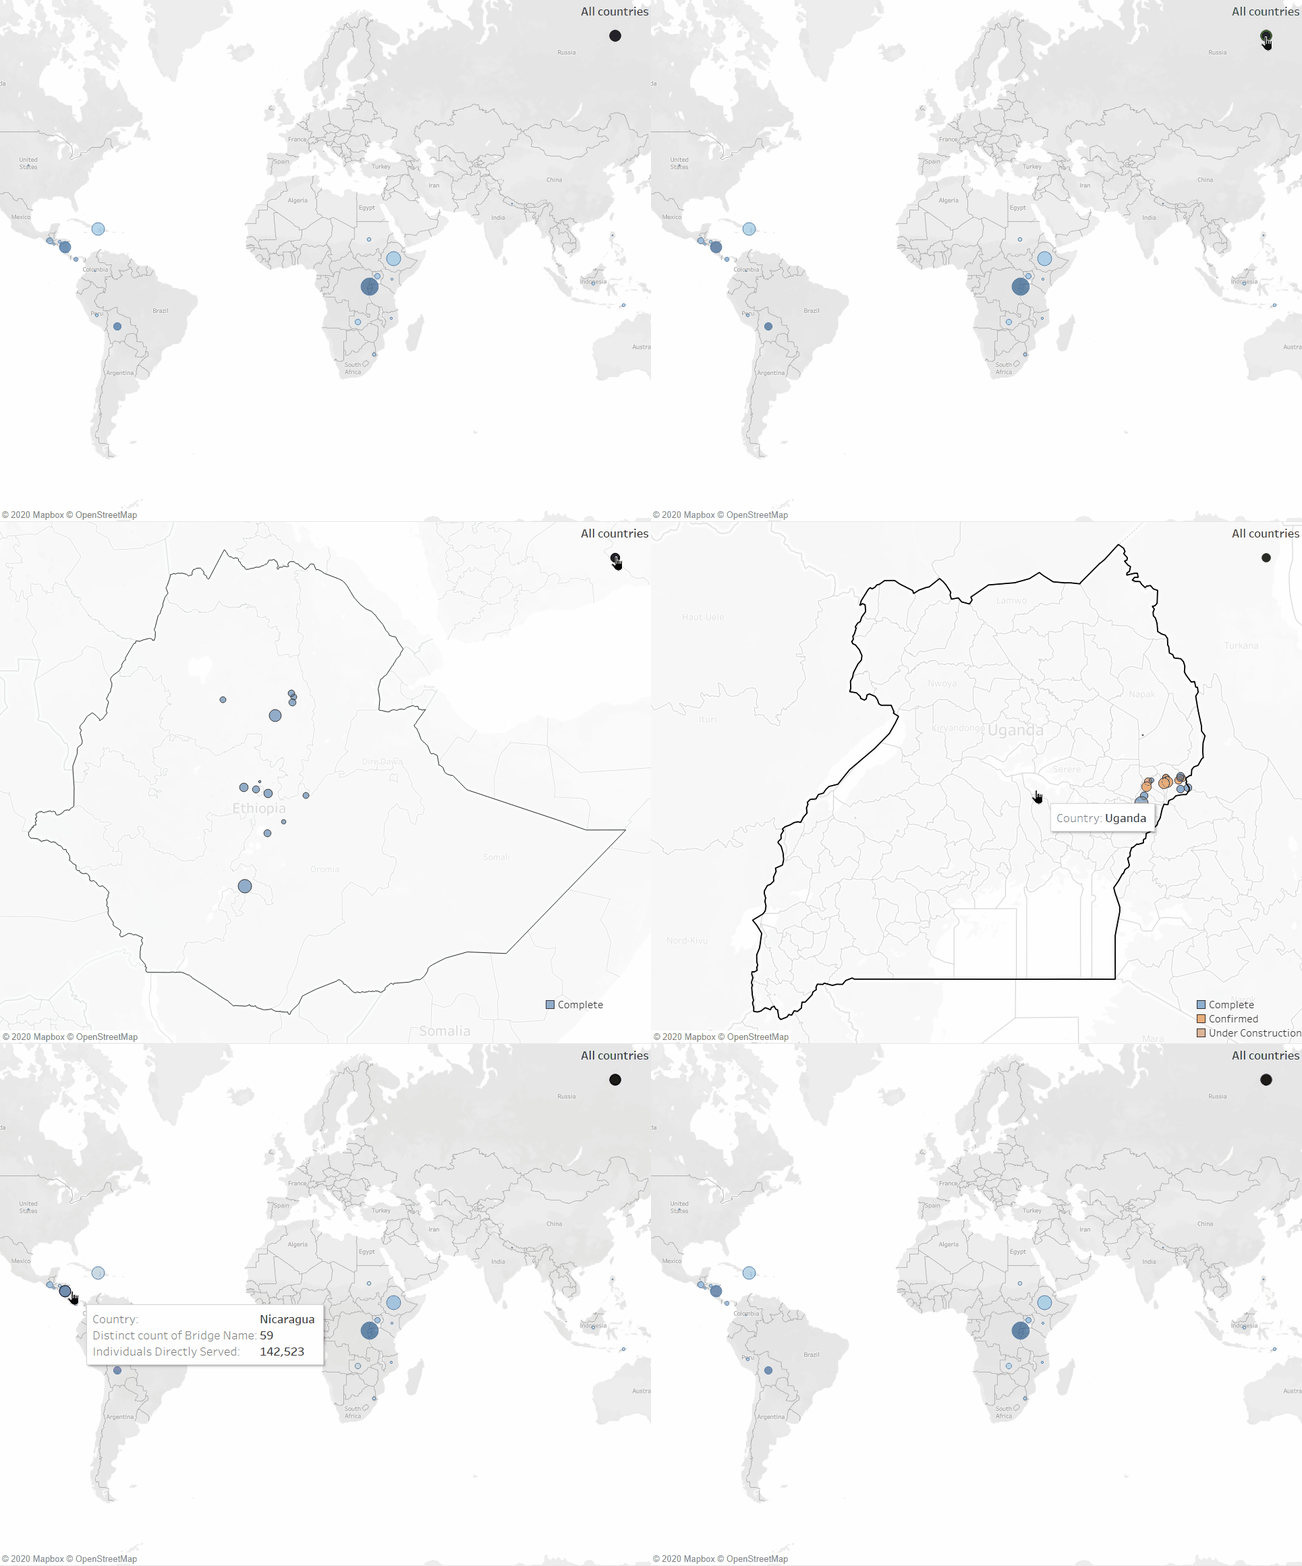
Joe Kernaghan walks us through a way of measuring distance between points with Tableau maps.
SQL window functions
Ken Flerlage shows us what SQL window functions are and the equivalent options in Tableau in his SQL window functions post on the Flerlage twins blog.
Creating a drill down map
The Information Lab take us through how to create a map that can be drilled down and up using multiple sheets on a dashboard in their creating a drilldown map post.
Inspiration & Visualisations
Here are some of the visualisations that caught our attention this week:
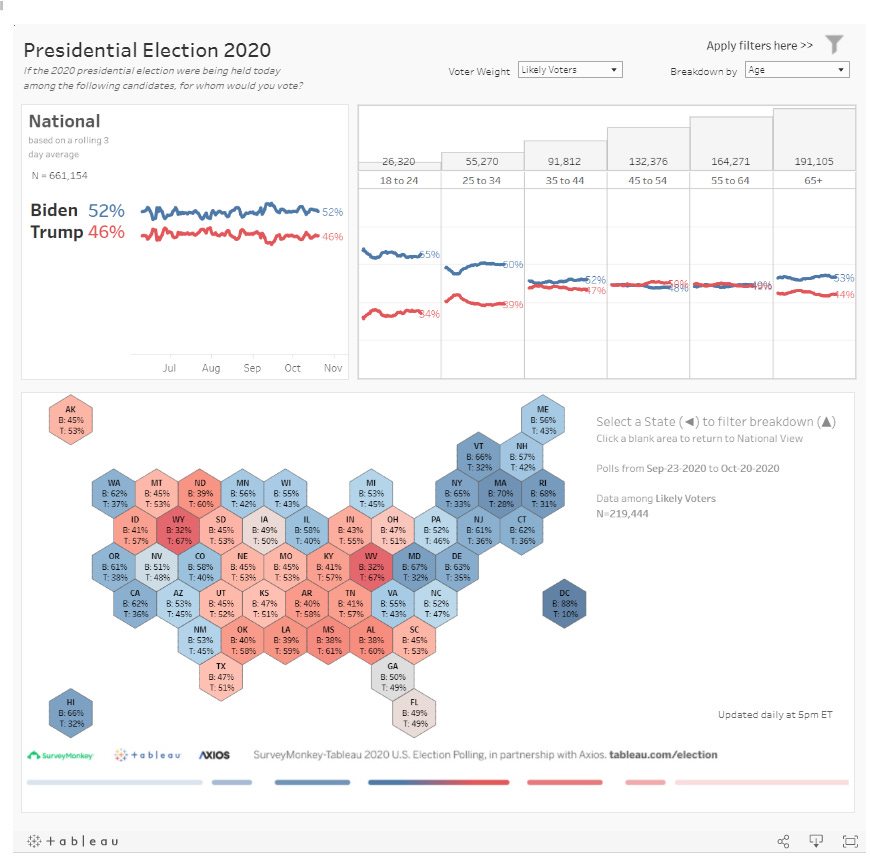
Tableau’s candidate preference dashboard:
Jennifer Dawes’ HR Employee Analysis Strength Finder Dashboard:
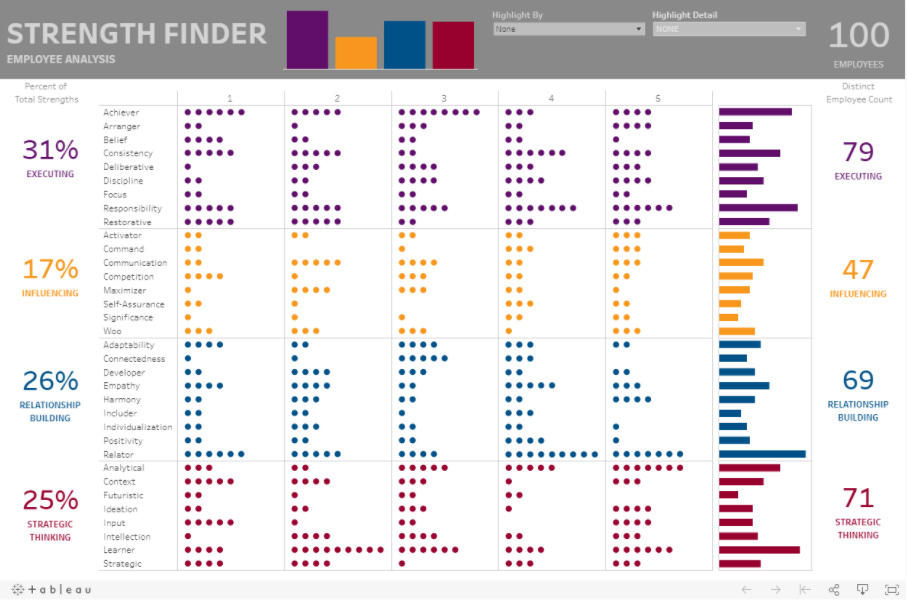
Tableau Community Initiatives
Preppin’ Data
The Preppin’ Data challenge for week 42 involves taking a sales transactions and sales targets dataset and creating a week, month and year to date view of the current year sales, previous year sales and performance v target.
Find more info and have a go at this weeks challenge here: https://preppindata.blogspot.com/2020/10/2020-week-42.html
The solution to the week 41 challenge can also be found here: https://preppindata.blogspot.com/2020/10/2020-week-41-solution.html
Makeover Monday
Last week’s Makeover Monday task was to makeover this super useful chart:
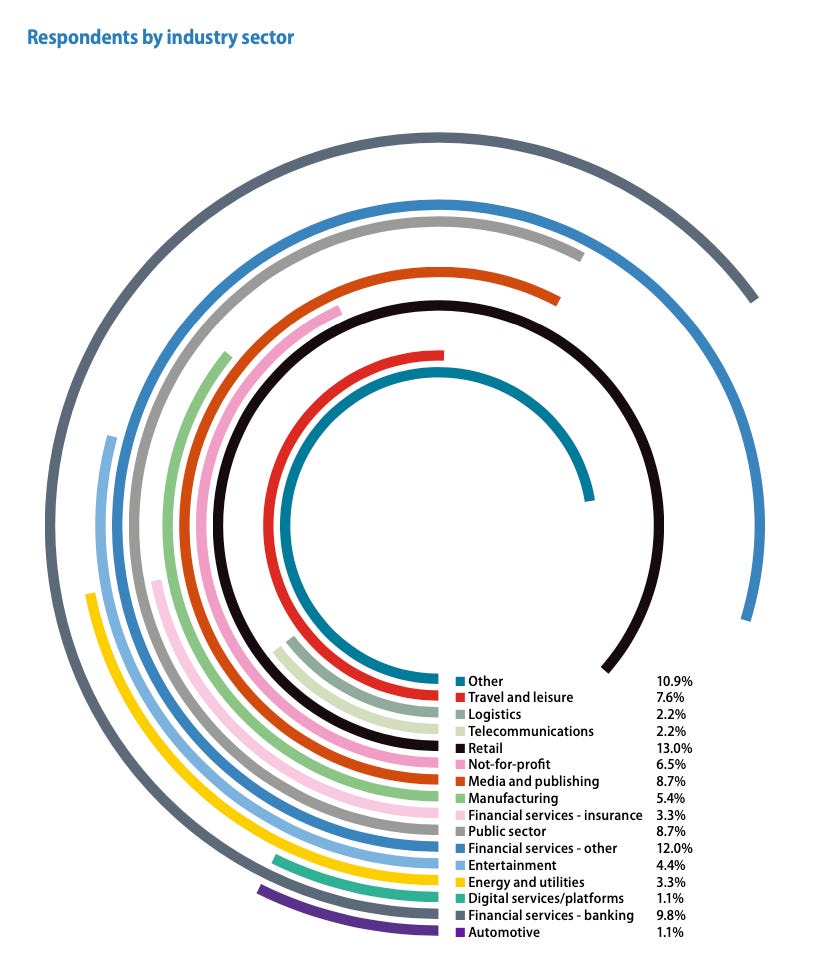
Simplicity would seem to be the key for this one, and a great example of why you should use the right chart for the job. Our favourite submissions were these 2 which show simple doesn’t need to be boring:
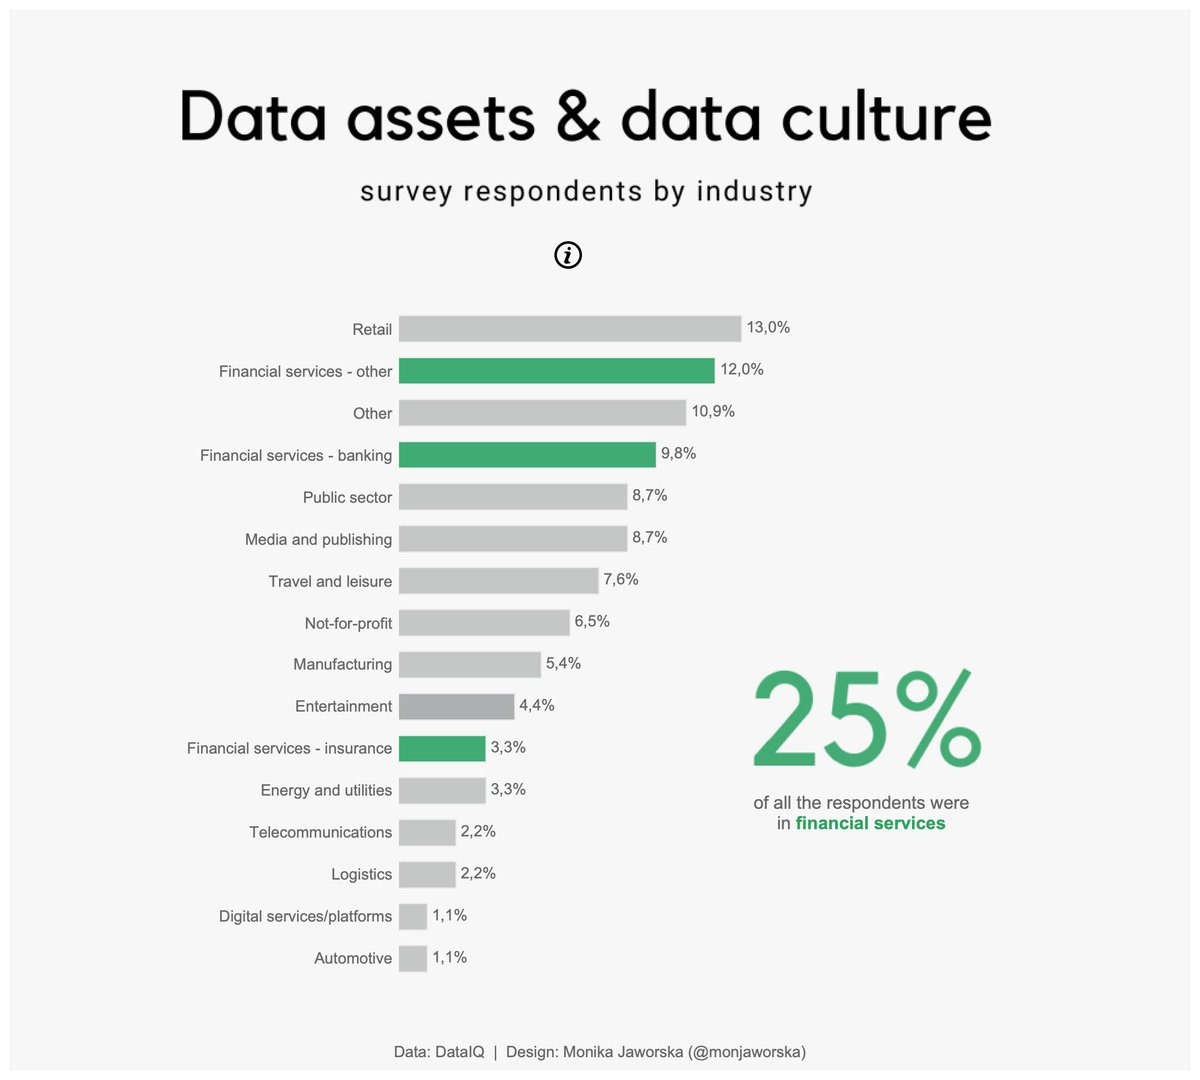
By @monjaworska
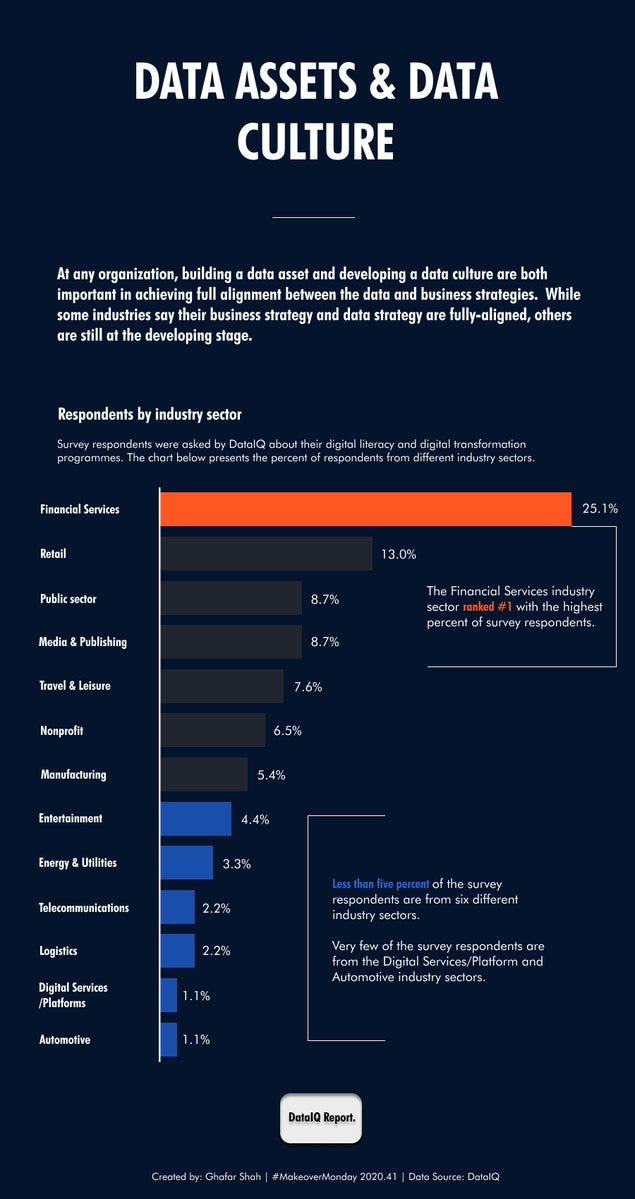
By @GhafarShah9
Eva Murray gives us her take here: trimydata.com/2020/10/12/mm2020-week41/ and you can check out the next challenge here: makeovermonday.co.uk/
Workout Wednesday
Week 43’s challenge is a two part one including replicating the design of a mobile dashboard as well as KPIs that act as buttons. Here’s what you’re trying to achieve:
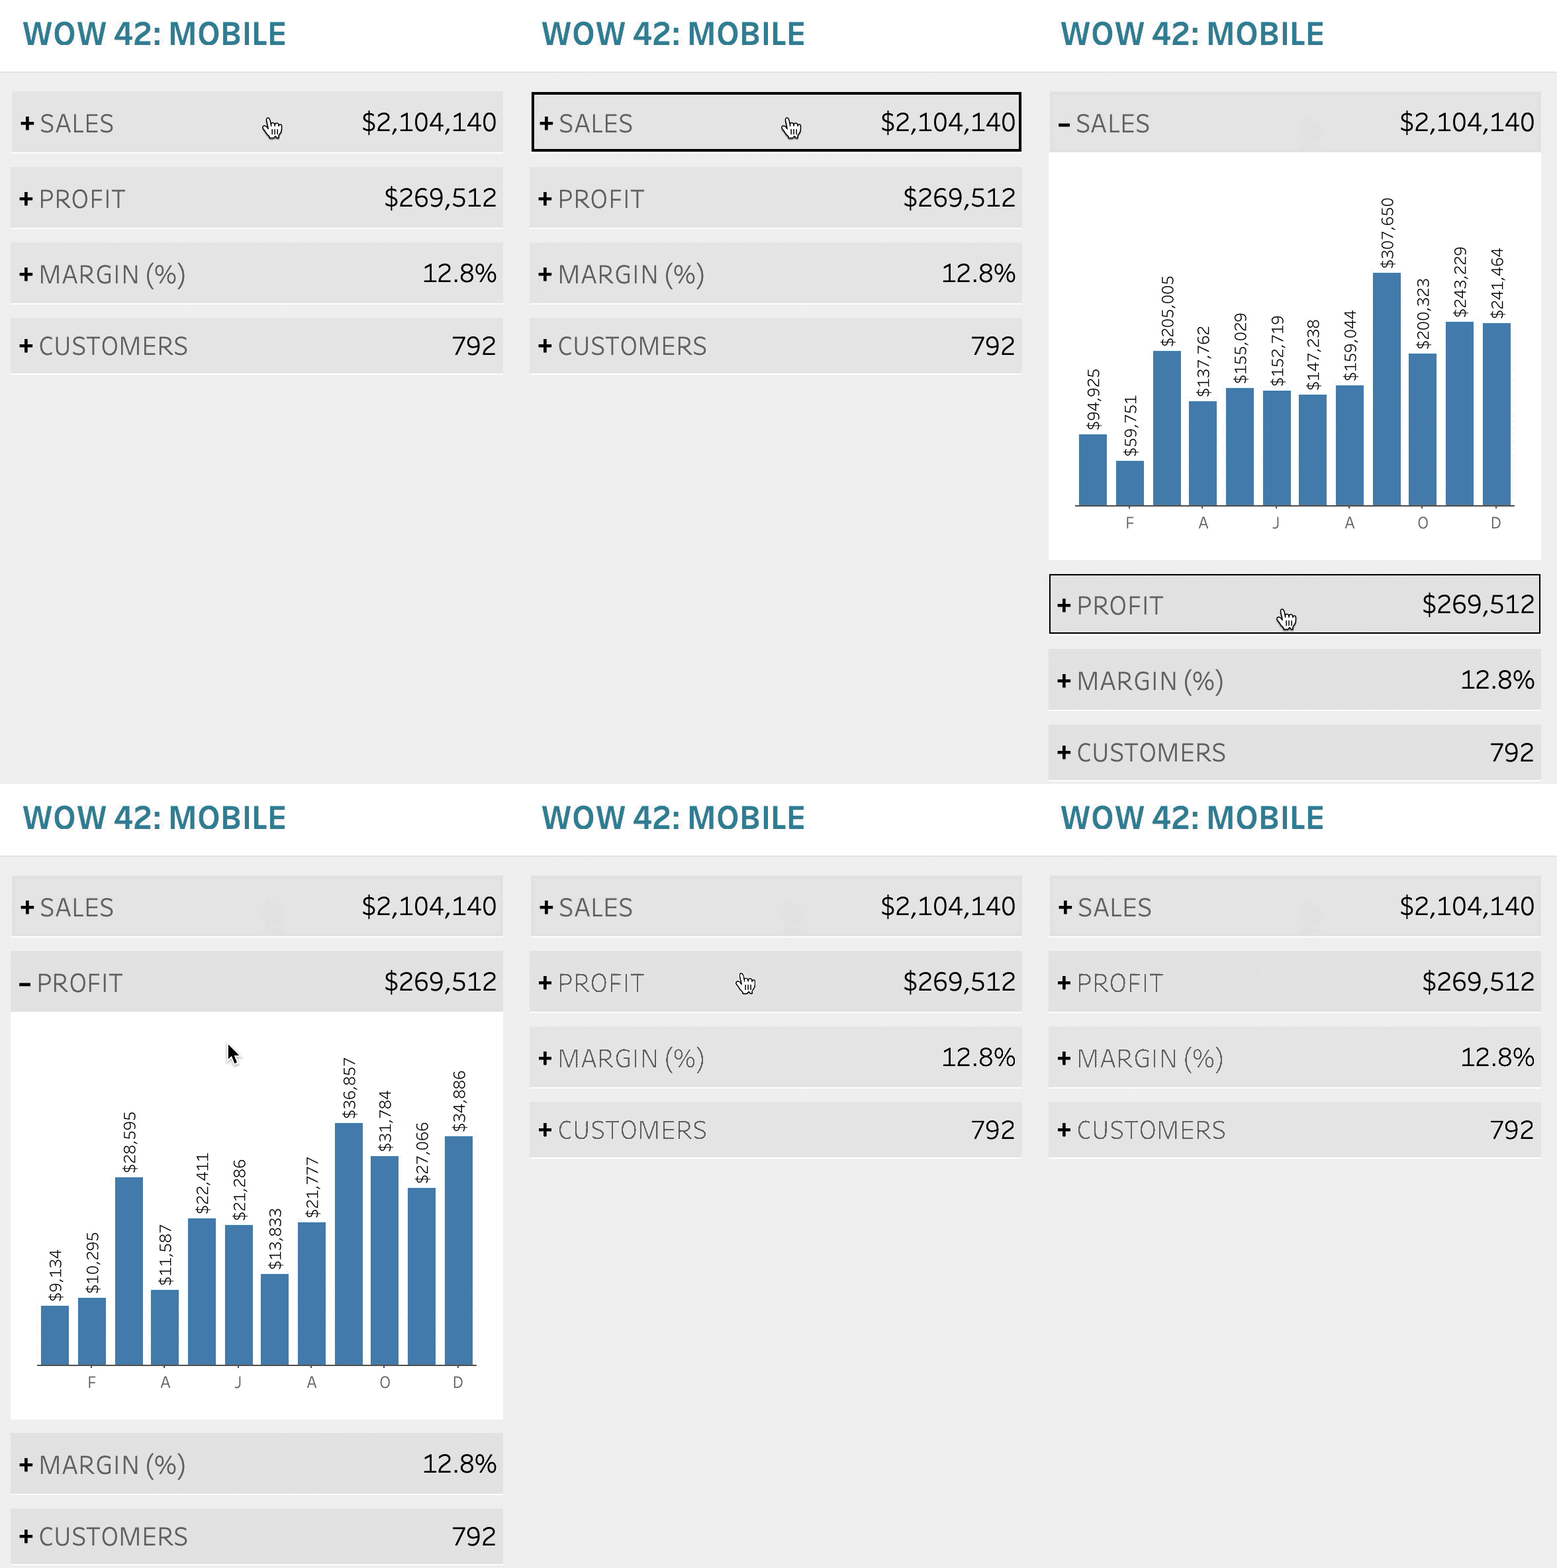
And here’s the details and how to take part: workout-wednesday.com/2020-week-43-mobile-dashboard-challenge/
Tableau News
Here we provide an insight into what’s new in the world of Tableau.
Big news from TC2020 is that Einstein Analytics is to become Tableau CRM and will be unified with Tableau in 2021, great news for any salesforce users!
The Tableau 2021 product roadmap was announced at TC2020 too, we can’t wait to see the re-designed notification centre and the new ways to organise projects on Tableau Server including collections and personal spaces. We’re also excited by the move towards online software with the auto save feature and Tableau Prep Builder in the browser which are on their way!
Tableau just announced it’s Data Literacy for All program, a free eLearning program that includes over five hours of training to help anyone learn foundational data skills.
Just announced at TC2020 as well was Tableau Foundations Equity Hub. Find out more and sign up to be notified when it’s live at https://www.tableau.com/foundation
Tableau 2020.4 is now available in preview Beta, join the Tableau pre-release program for more info and to get access.
We hope you enjoyed this 1st issue of our weekly Tableau Tea Break newsletter. Look out for issue 2 next week and if you liked what you read share or subscribe below
We’re interested to hear what you’d like to be featured in future issues, feel free to get in touch @TableauTeaBreak or linkedin.com/in/alan-m-murray/
Thanks,
Alan @ Tableau Tea Break.


